CryptoMox Blog
What Is a Doji Candlestick? A Trader's Guide
A Doji candlestick is one of those patterns that, once you see it, you can't unsee. It looks like a simple cross or plus sign, and it forms when an asset’s opening and closing prices are virtually the same. This tiny pattern packs a huge punch because it signals a moment of pure indecision in the market.
Think of it as a perfect stalemate. Buyers and sellers fought a fierce battle, pushing the price all over the place, but by the end of the session, neither side had won. The price ended up right back where it started.
The Power of a Pause in Crypto Trading
Imagine a high-stakes tug-of-war. For an entire trading period, the bulls pulled the price up, and the bears yanked it right back down. When the dust settled, the rope hadn't moved an inch. That’s a Doji. This equilibrium is a powerful signal for crypto traders because it often means a strong trend is running out of gas.
This simple pattern is a cornerstone of technical analysis, with roots stretching back to 18th-century Japanese rice trading. Its significance isn't just historical; it’s backed by data. One major study of over 100,000 patterns found that Dojis showed up on about 3.2% of all trading days, appearing even more frequently when the market gets choppy. You can dig deeper into the statistical findings on candlestick patterns and their history to see just how reliable they can be.
What a Doji Really Signals
At its heart, a Doji is all about market psychology. It’s a visual cue that the conviction behind the current price move is starting to crumble. This pause is critical because it can be the calm before a storm—a potential shift in market direction.
So, what is a Doji telling you?
- In an Uptrend: It whispers that the buyers are getting tired. Sellers are stepping in and matching their strength, which could be an early warning of a bearish reversal. Example: Bitcoin has rallied for five straight days. On the sixth day, a Doji forms. This doesn't mean sell immediately, but it's an actionable signal to tighten your stop-loss or consider taking partial profits, as the bullish momentum is clearly fading.
- In a Downtrend: It suggests the sellers are losing their grip. Buyers are starting to show up and defend a price level, often hinting at a bullish reversal around the corner. Example: After a week of decline, Solana (SOL) forms a Doji near a previous low. This is your cue to watch for a follow-up green candle, which could signal a potential entry for a long position.
- In a Sideways Market: It just confirms what you already know—the market is directionless and waiting for a catalyst.
This table breaks down the core components of a standard Doji for quick reference.
Key Characteristics of a Doji Candlestick
| Characteristic | Description | What It Signals |
|---|---|---|
| Body | Extremely thin or non-existent (open ≈ close). | A perfect balance between buying and selling pressure. |
| Wicks (Shadows) | Can be long or short, extending above and below the body. | The trading range of the session, showing volatility. |
| Appearance | A cross, plus sign, or inverted cross. | Visual representation of market indecision. |
| Psychology | Represents a tug-of-war with no clear winner. | The dominant trend (bullish or bearish) is weakening. |
Ultimately, a Doji is more of a question than an answer.
A Doji candlestick is less of a direct trade signal and more of a question the market is asking: "Is the current trend still valid?" Your job as a trader is to watch the following price action for the answer.
Getting these foundational patterns down is the first step toward becoming a savvy chart reader. If you want to build a solid base, our guide on how to read crypto charts is the perfect place to start.
Decoding the Four Main Types of Doji Patterns
While the basic Doji screams indecision, its different variations tell a much more nuanced story about the tug-of-war between buyers and sellers. Learning to spot these subtle differences is crucial for getting a read on what the market might do next. Simply put, not all Dojis are created equal.
Think of it like reading a person's body language. A neutral expression is tough to read, but a slight smirk or a furrowed brow gives you a much better clue about what they're thinking. The same logic applies to Doji variations—the length and position of the wicks reveal whether the bulls or bears are starting to get the upper hand.
This visual map breaks down the core idea: a Doji represents that critical moment of balance right before the market picks a direction.
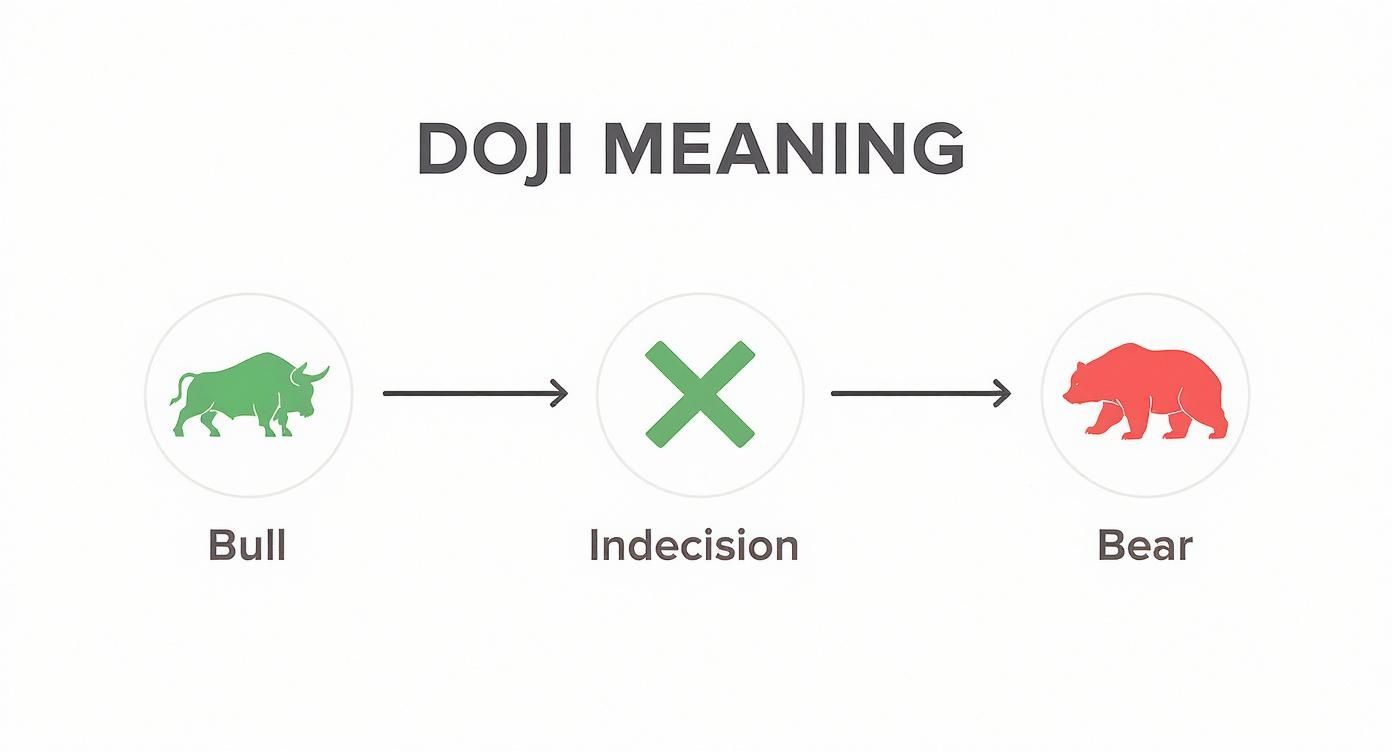
As the infographic shows, the market is in a state of equilibrium. From here, it can tip in favor of either the buyers (bulls) or the sellers (bears), which is why the Doji is such a critical pattern for traders to watch.
Standard and Long-Legged Doji
The Standard Doji, which looks like a simple plus sign (+), is the purest signal of a market pause. Its wicks are short and roughly equal on both sides, telling us that price didn't really go anywhere significant. The session was a stalemate, and the market is just catching its breath.
The Long-Legged Doji, on the other hand, is the more dramatic version. You'll see much longer wicks extending both up and down, which means the trading session was filled with volatility. But even with all that price action, neither side could claim victory. This intense, unresolved battle signals even greater uncertainty and often precedes a major turning point. Actionable Insight: The wider range of a Long-Legged Doji gives you clear levels for placing a stop-loss. If you're anticipating a reversal, your stop would go just outside the high or low of its long wick.
Dragonfly and Gravestone Doji
These two are the real head-turners. Unlike their neutral cousins, Dragonfly and Gravestone Dojis offer much clearer clues about a potential reversal.
Dragonfly Doji: Shaped like a "T," this pattern has a long lower wick and almost no upper wick. It tells a clear bullish story. The sellers tried to hammer the price down, but the buyers came roaring back, rejecting those lower prices and pushing the close right back up to where it opened. When you see this after a downtrend, it’s a powerful sign that buying pressure is building. Example: An altcoin is in a sharp downtrend and prints a Dragonfly Doji. The long lower wick shows buyers aggressively bought the dip. This is a strong hint that a bottom may be forming.
Gravestone Doji: This is the mirror image of the Dragonfly, looking like an inverted "T." Here, a long upper wick shows that buyers initially took control and pushed the price higher. But then, the sellers stepped in and slammed it all the way back down. After a strong uptrend, this is a loud warning that selling pressure is taking over and the rally might be finished. Example: After a multi-day pump, a meme coin forms a Gravestone Doji. This indicates that early bulls tried to push the price even higher but were overwhelmed by sellers taking profits. This is a classic "exhaustion" signal.
A simple way to remember these: the Dragonfly looks like it's ready to fly up (bullish), while the Gravestone marks the "grave" of an uptrend (bearish).
Finally, you might occasionally spot a Four-Price Doji, which is just a single horizontal line. This rare pattern shows up when the open, high, low, and close are all the exact same price. It signals a market with practically zero trading activity or interest—a state of total apathy you won't see often in the fast-moving crypto markets.
Reading the Psychology Behind a Doji Signal
Spotting a Doji is easy. The real skill is learning to read the story it’s telling you about the market. Think of each Doji as a snapshot of a fierce battle between buyers and sellers—a brief moment of perfect equilibrium where neither side can claim victory.
Imagine an asset in a strong uptrend. It's like a car speeding down the highway, with buyers firmly pressing the accelerator. A Doji appearing at the top of that rally is like the driver suddenly easing off the gas. The car hasn't slammed on the brakes or gone into reverse, but all that forward momentum has vanished. This pause is a powerful clue that buying pressure is drying up, and sellers are finally showing up in force.
The same idea holds true in a downtrend. When sellers have been in complete control, a Doji signals that they're finally getting exhausted. Buyers, who have been waiting on the sidelines, are now stepping in with enough conviction to stop the bleeding. That moment of indecision is often the first real sign that the bearish control is slipping, paving the way for a reversal.
Context Is Everything
A Doji’s meaning changes dramatically depending on where it shows up. If you see one floating around in the middle of a messy, sideways market, it’s mostly just noise. It confirms what you already know: nobody is in charge.
But when a Doji appears at a significant price level that has acted as a floor or ceiling in the past? That’s when you need to pay close attention.
The most powerful Doji signals appear at key support or resistance levels. They act as a confirmation that the established price barrier is holding and that the prevailing trend is being challenged.
Example: Let's say ETH/USD has been dropping hard for days and then prints a Dragonfly Doji right on top of a known support zone at $3,000. This isn't just random indecision. It’s a loud-and-clear signal that buyers are stepping up to aggressively defend that price. This blend of a powerful pattern at a critical location is what creates a high-probability trading setup. Your actionable insight is to look for a long entry on the next candle if it closes above the Doji's high, with a stop-loss placed just below the $3,000 support level.
Statistical Significance of Dojis in Trends
This isn’t just chart folklore; there's data to back it up. An extensive analysis looking at Doji performance in 15 major markets over a decade found some compelling results. After a bullish trend gained at least 10%, a Doji that followed signaled a reversal 56% of the time within the next ten trading periods. The pattern had similar predictive power in downtrends. To dig deeper, you can read the full research on Doji candlestick pattern insights and see just how much context matters.
By learning to read the psychology behind a Doji, you stop just seeing shapes on a screen. You start to understand the delicate balance of power between bulls and bears, giving you a much clearer idea of when a trend is about to run out of steam.
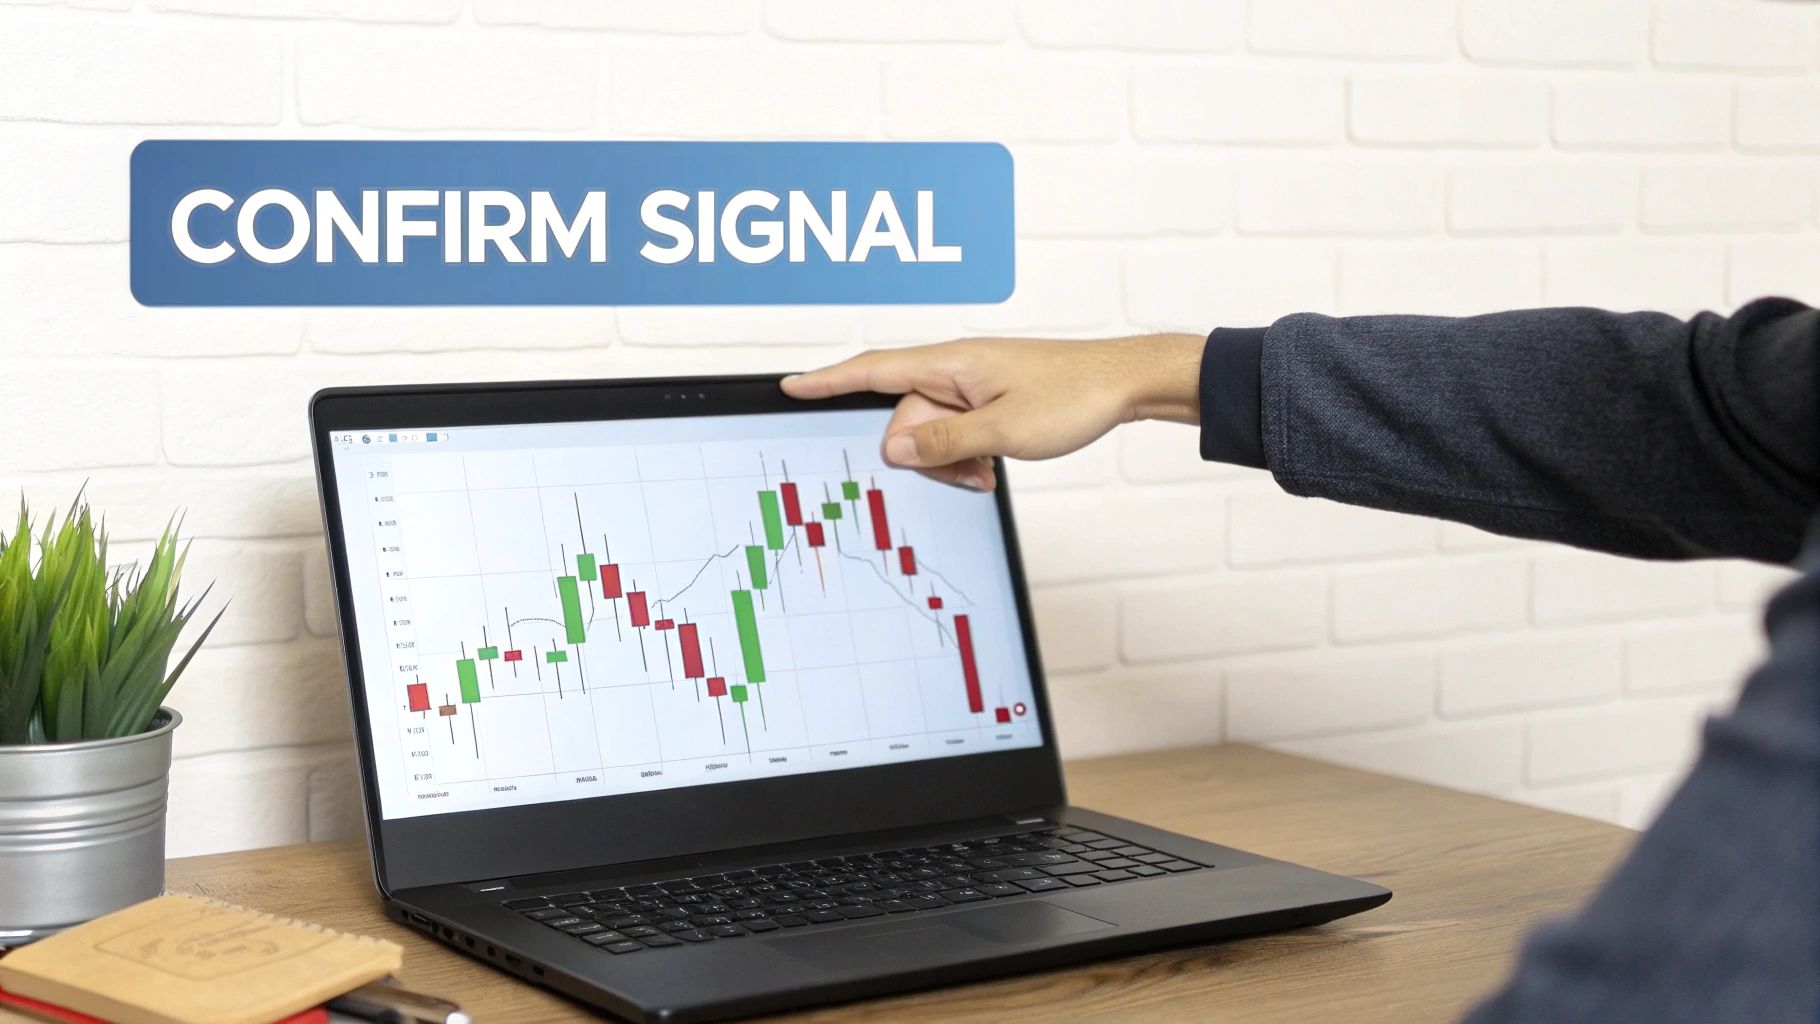
Confirming a Doji Signal Before You Trade
A Doji candlestick is a flashing yellow light, not a green one. It's a sign to pay close attention, but it's not a direct command to buy or sell. One of the biggest mistakes I see traders make is jumping the gun and acting on a Doji without waiting for the market to show its hand.
Think of it this way: treating a Doji as a guaranteed signal is like hearing a smoke alarm and immediately running out of the building. It might be a real fire, or it might just be burnt toast. You need more evidence before you act. To avoid these false alarms, you need a simple, repeatable process to validate what the Doji is hinting at.
Let's break down the three key things to look for.
Check Trading Volume
First, always glance at the trading volume on the Doji candle itself. Volume is the fuel behind the price; it tells you how much conviction is packed into that candle.
A Doji that prints on high volume is a big deal. It means a serious tug-of-war happened between buyers and sellers, and they fought to a perfect standstill. That's a powerful statement.
On the flip side, a Doji on low volume doesn't carry nearly as much weight. It often just means the market was quiet and nobody was really participating. That's not indecision—it's just apathy. Actionable Insight: Before acting on a Doji, check if its volume bar is taller than the average of the last 10-20 bars. If it is, the signal is far more significant.
Assess the Market Context
Context is everything. A Doji floating in the middle of a price range is mostly noise. But a Doji that appears at a historically important price level? Now that's interesting.
Always check to see if the Doji has formed near a key support or resistance zone.
- At Support: Picture a Dragonfly Doji forming right on a strong support level. This is a classic sign that buyers are stepping in with force to defend that price, suggesting the floor might hold.
- At Resistance: Now imagine a Gravestone Doji appearing at a major resistance level. This tells you sellers are actively rejecting higher prices, reinforcing the idea that the price ceiling is solid.
When you combine a Doji with other signals, its reliability gets a serious boost. In fact, one 2023 study found that Dojis appearing at trend extremes had a reversal probability of 61.3% over the next five trading sessions. For the EUR/USD pair, that figure jumped to 62.1% for bearish reversals when the market was overbought. You can read more about the power of Doji patterns as reversal indicators when used with other tools.
Watch the Next Candle for Follow-Through
This is, without a doubt, the most important confirmation step. The candle that forms after the Doji is the one that tells you who won the battle. Without this follow-through, a Doji is just an unresolved pause in the action.
A Doji candlestick signals indecision. The next candle signals the decision. Always wait for the market to show its hand before you place your trade.
Here are two simple "if-then" rules to guide your thinking:
- IF a Dragonfly Doji forms at support, THEN wait for a bullish (green) candle to close above the Doji's high before you even think about entering a long position.
- IF a Gravestone Doji forms at resistance, THEN wait for a bearish (red) candle to close below the Doji's low before considering a short.
This patient, evidence-based approach is the foundation of successful trading. It's the same logic that underpins many automated systems, which you can learn more about in our guide on algorithmic trading strategies.
To make this even easier, here's a quick checklist you can run through whenever you spot a Doji on your charts.
Doji Signal Confirmation Checklist
Use this checklist to systematically evaluate the strength of a Doji pattern. The more checks you can tick off, the higher the probability that the signal is valid.
| Confirmation Factor | What to Look For | Signal Strength |
|---|---|---|
| Trading Volume | Is volume significantly higher than the preceding candles? | High: Stronger Signal |
| Market Context | Does the Doji appear at a key support or resistance level? | High: Stronger Signal |
| Trend Location | Is it at the top of a long uptrend or bottom of a downtrend? | High: Stronger Signal |
| Subsequent Candle | Did the next candle close decisively in the expected direction? | Crucial: Without this, the signal is unconfirmed. |
By waiting for these factors to align, you move from simply spotting a pattern to making a well-reasoned trading decision.
Integrating Doji Patterns with Other Trading Tools
A Doji candlestick is a powerful glimpse into market psychology, but let's be clear: it's almost never a signal you should trade in isolation. To turn a hint of indecision into a high-confidence trade, you have to pair it with other tools.
Think of it like a detective finding a single clue at a crime scene. That clue is interesting, but it only becomes powerful when you combine it with other pieces of evidence.
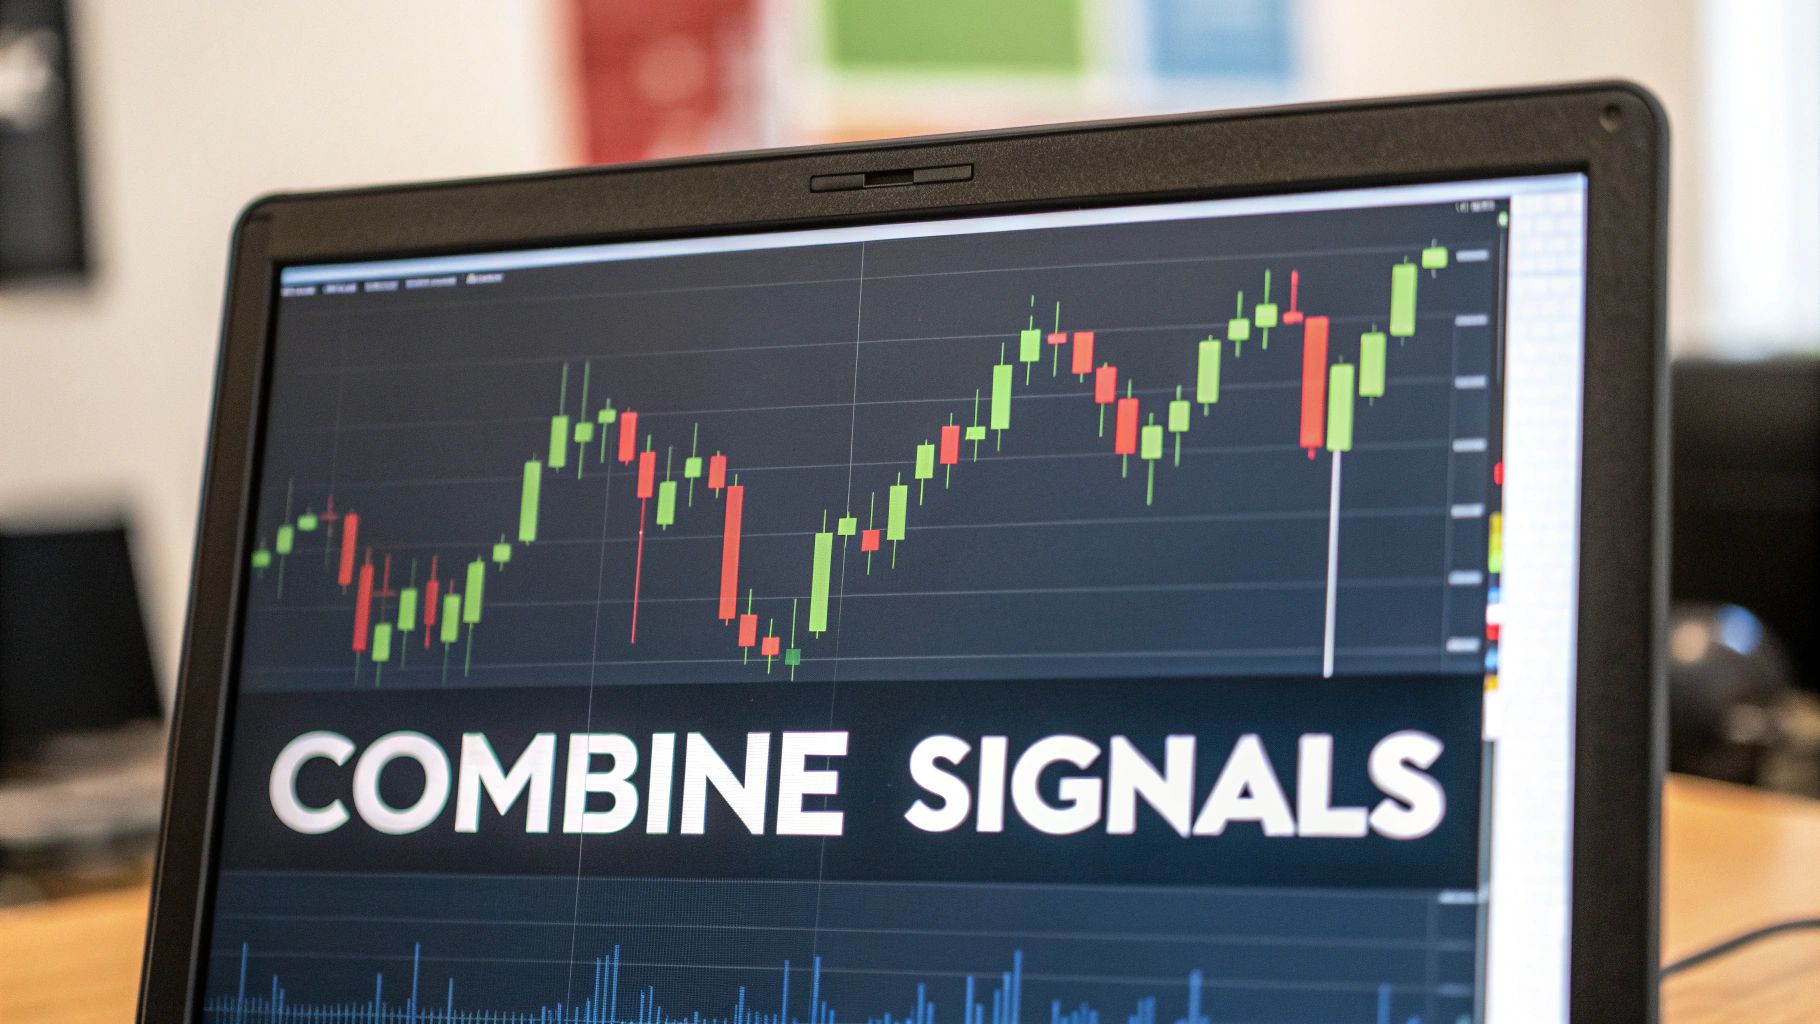
This process of "signal stacking" is what separates amateur traders from pros. It's about filtering out the market noise and building a solid, data-backed case for your trade before you put any capital on the line.
Combining Dojis with Momentum Indicators
Momentum indicators like the Relative Strength Index (RSI) are a natural fit for Doji patterns. Why? Because they measure the speed and strength of price moves, telling you when a trend is running out of steam. The RSI flags overbought conditions (usually above 70) and oversold conditions (below 30), which are often the breeding grounds for reversals.
When a Doji and an RSI signal line up, the message is hard to ignore.
A Gravestone Doji that appears while the RSI is screaming "overbought" is a much more potent bearish signal than either one would be alone. It tells you that a stalemate has hit right when the buyers are completely exhausted.
Here’s how this plays out in the real world:
- Bullish Setup Example: You spot a Dragonfly Doji after a nasty downtrend in Chainlink (LINK). You glance at the RSI and see it’s been crushed down below 30 (oversold). This combination strongly suggests the sellers have finally run out of ammo and buyers are defending a potential bottom. Your action is to prepare for a long entry if the next candle confirms the move.
- Bearish Setup Example: A coin has been on a tear, but a Long-Legged Doji suddenly prints at the top. A quick check shows the RSI is well above 70 (overbought). This is your warning sign that the buying pressure is fading fast and a reversal could be just around the corner. Your action is to exit any long positions or look for a confirmed short entry.
Using Moving Averages for Context
Moving averages are fantastic for giving you the bigger picture. They define the overall trend and often act as dynamic areas of support and resistance. When a Doji forms right on a key moving average, it gives the signal a whole new level of importance.
Actionable Example: Imagine a stock is in a healthy uptrend, consistently staying above its 50-day moving average (50MA). The price pulls back to test the 50MA and forms a Dragonfly Doji that bounces perfectly off of it. This is a classic A+ long setup. It shows that buyers are not just present; they're actively defending the established trend at a critical level.
You can dive deeper into choosing the right tools in our guide to the best technical indicators for swing trading.
By pulling these tools together, you can build a complete trading plan around a simple Doji candle:
- Entry Trigger: Don't jump the gun. Wait for the next candle to close in the direction you expect the market to go. That's your confirmation.
- Stop-Loss Placement: Place your stop just beyond the wick of the Doji—below the low for a long position, or above the high for a short. This clearly defines your risk from the outset.
- Profit Target: Look for the next logical support or resistance level on the chart and use that to set a realistic profit target.
Common Mistakes to Avoid When Trading Dojis
A Doji can be a powerful signal, but it's also a magnet for rookie mistakes. Learning to spot these pitfalls is just as crucial as understanding the pattern itself. Get this wrong, and you'll find yourself on the losing side of a trade more often than not.
The biggest trap? Thinking every Doji is a screaming reversal signal. It's not. A Doji is first and foremost a sign of indecision—a momentary pause where neither buyers nor sellers are in control. The market might be catching its breath before continuing right along with the established trend.
Ignoring the Broader Market Trend
Here's another classic error: fighting a powerful, established trend based on a single Doji. Shorting a strong bull run because you spotted one Gravestone Doji is like trying to stop a freight train with a pebble. The odds are just not in your favor.
Doji signals are far more reliable when they pop up in confluence with the overall market structure. For instance, a Dragonfly Doji forming at a key support level during a larger uptrend is a high-probability buy signal. That same Doji appearing in a market that's in a nosedive? Far less convincing.
Think of a Doji as a sign of a potential shift in momentum, not necessarily a change in the primary trend. Always trade with the current, not against it.
Misinterpreting Low-Volume Dojis
Context is everything in trading, and volume is a huge piece of that puzzle. A Doji that forms on light, anemic volume is usually just market noise. It doesn't represent a real battle between bulls and bears; it just means nobody showed up to the fight.
On the other hand, a Doji that appears on a massive volume spike demands your attention. That tells you a genuine tug-of-war just took place, and the eventual winner will likely push the price with real force. Flying blind without checking the volume is a surefire way to get faked out.
To stay safe, you need a solid risk management plan. Here are three simple rules to keep you out of trouble:
- Always Use a Stop-Loss: This one's non-negotiable. For a short trade, place your stop just above the high of a Gravestone Doji. For a long, place it just below the low of a Dragonfly. This caps your risk before you even enter.
- Wait for Confirmation: Don't jump the gun. Never enter a trade based on the Doji candle alone. Wait for the next candle to close to see which way the market breaks.
- Adjust Position Size: A Long-Legged Doji screams volatility. When you see one, it's smart to reduce your position size to account for the wider price swings and keep your risk in check.
Common Questions About Doji Candlesticks
When you're first getting the hang of chart patterns, the Doji often brings up some recurring questions. Let's clear up a few of the most common ones traders ask.
Is a Doji a Guaranteed Reversal Signal?
Not at all, and it's a mistake to think so. A Doji is first and foremost a signal of indecision. It shows the market is hitting the brakes on the current trend.
While this pause often happens right at a market top or bottom, it can just as easily be a quick breather before the trend kicks back into gear. Example: During a strong uptrend, a Standard Doji appears. The next candle is a large green candle that continues the trend. This is called a "continuation pattern," where the Doji was just a brief pause for breath.
Think of a Doji as a yellow light at an intersection, not a red one. It’s a signal to pay close attention and wait to see what happens next—not a command to slam on the brakes and reverse course.
Does a Doji Mean the Same Thing on Every Timeframe?
Yes and no. A Doji can show up on any chart you pull up, whether it’s a 1-minute intraday chart or a weekly one. The pattern's meaning, however, gets much stronger as you zoom out.
A Doji on a daily or weekly chart represents a major, prolonged struggle between buyers and sellers. The one you see on a 5-minute chart? It reflects a much shorter, less significant standoff. As a rule of thumb, the higher the timeframe, the more weight a Doji carries.
What's the Difference Between a Doji and a Spinning Top?
This is a great question because they look so similar and both signal indecision. The key difference is the body. A Spinning Top has a small, but still noticeable, rectangular body. This tells you the closing price was a little different from the opening price.
A true Doji, on the other hand, has a body that’s just a thin horizontal line. The open and close are practically the same, signaling a perfect, though often brief, deadlock between the bulls and the bears.
Ready to move beyond indicators that only tell you what already happened? CryptoMox overlays AI-powered price projections directly onto your charts, helping you see where the market might be heading next. Start your 7-day trial and trade with a forward-looking edge.