CryptoMox Blog
Crypto Trading with MACD and RSI Explained
Pairing the MACD with the RSI gives traders a powerful one-two punch. Think of it this way: the MACD tells you about the trend's momentum, while the RSI measures how strong the price is right now. Using them together helps you sidestep false signals, because you're waiting for both indicators to agree before you jump into a trade. This naturally leads to more disciplined and higher-probability setups.
How to Read Market Momentum with MACD
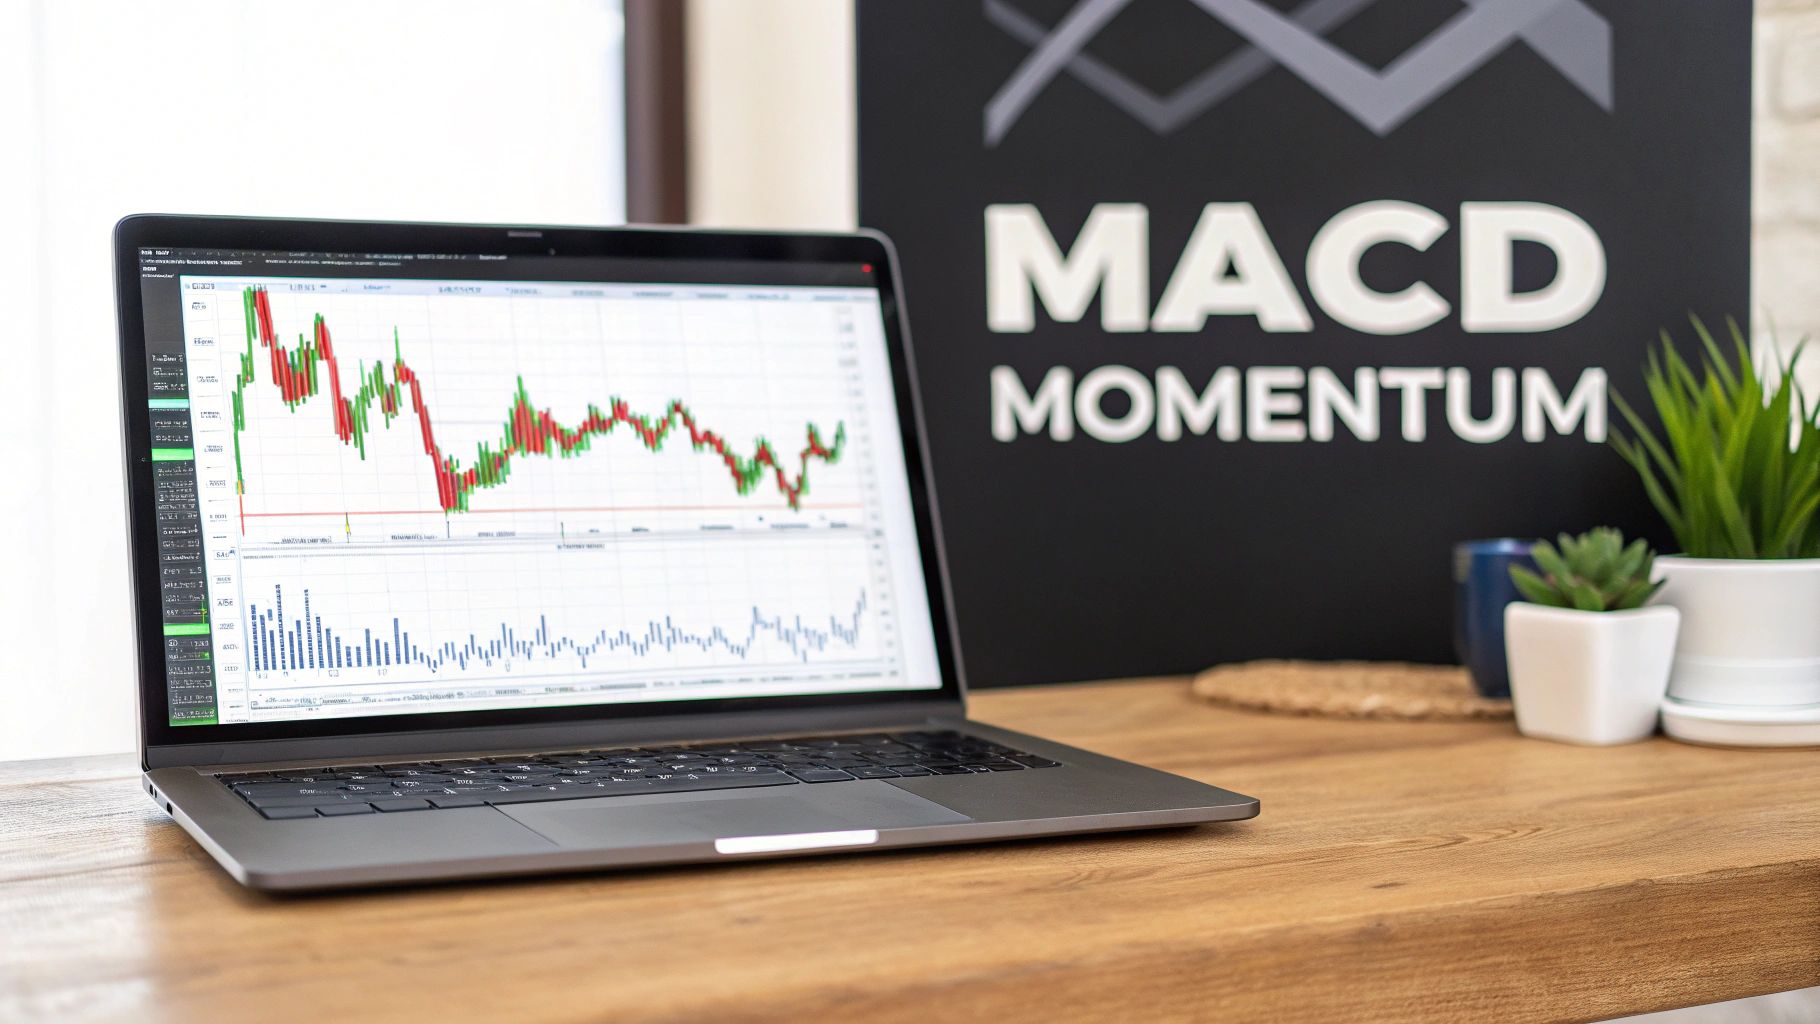
The Moving Average Convergence Divergence (MACD) is like your personal trend radar. It’s designed to cut through the day-to-day price noise and show you the real momentum driving a cryptocurrency. At its heart, the MACD simply illustrates the relationship between two moving averages, helping you spot when a trend is picking up steam or starting to fizzle out.
To really get a feel for it, you need to know its three core parts:
- The MACD Line: This is the indicator's engine. It’s calculated by subtracting the 26-period Exponential Moving Average (EMA) from the faster 12-period EMA.
- The Signal Line: This is a 9-period EMA of the MACD line itself. It acts as a baseline, helping to smooth things out and clearly show when momentum is shifting.
- The Histogram: These bars show you the distance between the MACD line and the Signal line. When the bars get taller, momentum is strong. When they start to shrink, momentum is fading.
Understanding MACD Crossovers
The most straightforward signals from the MACD are crossovers. Picture two race cars: a faster one (the MACD line) and a slightly slower one (the signal line). When the faster car zips past the slower one, it’s a sign that something is about to change.
A bullish crossover is when the MACD line crosses above the signal line. This is a heads-up that positive momentum is building and an upward price move could be on the horizon. On the flip side, a bearish crossover happens when the MACD line dips below the signal line, suggesting that downward momentum is taking control.
Actionable Example: Imagine Bitcoin is trading at $60,000. You notice on the daily chart that the blue MACD line has just crossed above the orange signal line. This is your cue to start looking for a potential long entry, as it suggests the bulls are gaining strength for a possible move towards $65,000.
Spotting Divergence for Reversal Warnings
Crossovers are great, but the real magic of the MACD is in spotting divergence. Divergence is a powerful warning sign that flashes when the indicator's movement doesn't match what the price is doing on the chart. Getting this down is a huge step in learning how to read crypto charts like a pro.
Here’s an example: if a crypto's price is carving out new higher highs, but the MACD indicator is making lower highs, that’s bearish divergence. It’s a classic red flag that the upward trend is losing its legs and a reversal might be coming.
Likewise, if the price is making lower lows while the MACD is making higher lows, you're seeing bullish divergence. This hints that the downtrend is running out of gas. These signals often pop up before the price actually turns, giving you a valuable head start.
Actionable Example: Let's say Ethereum's price pushes up to a new high of $3,500, but when you look at the MACD, its peak is lower than the one it made when ETH was at $3,300. This bearish divergence is a strong warning. An actionable insight here is to tighten your stop-loss on existing long positions or consider taking some profits off the table before a potential drop.
How to Measure Price Strength with RSI
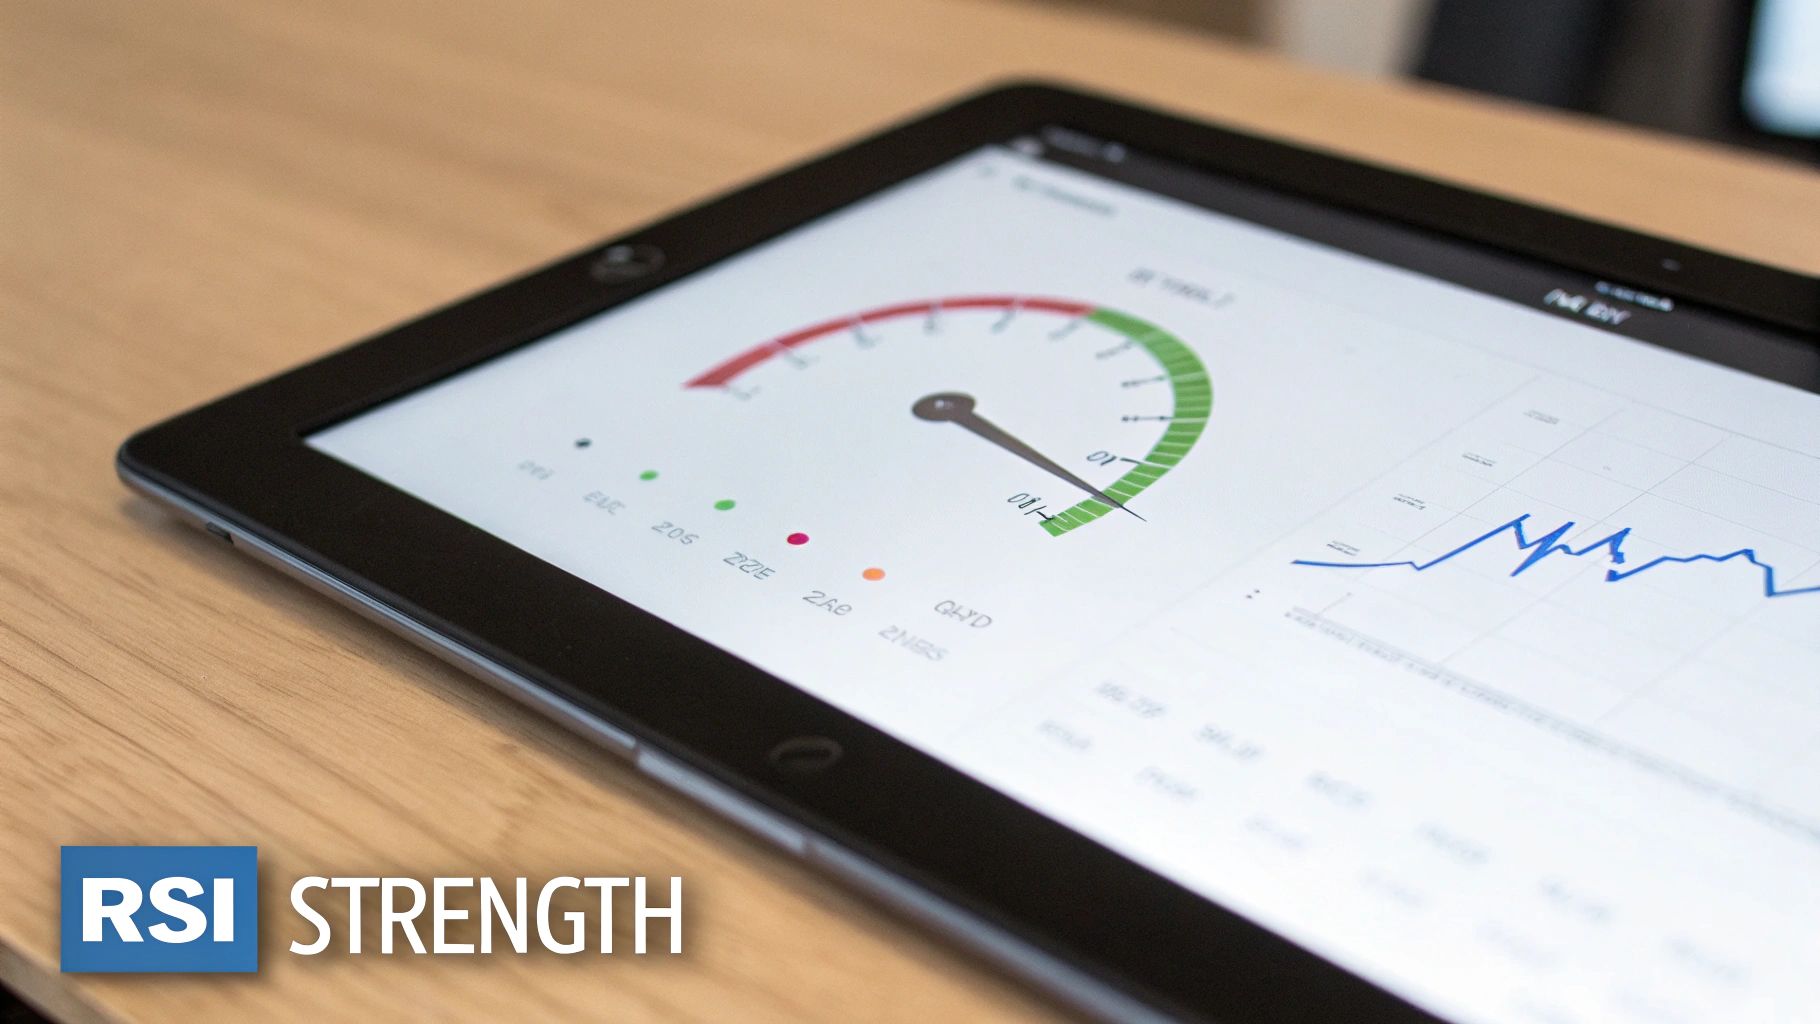
While the MACD is great for spotting trend momentum, the Relative Strength Index (RSI) is more like a crypto asset's fuel gauge. It’s a classic momentum oscillator that tells you how fast and how far prices have moved, plotting the results on a simple 0 to 100 scale.
I like to think of the RSI as a tachometer on a car's dashboard. When the needle pushes into the red, you know the engine is working hard, but it can't sustain that level of output indefinitely. The RSI works the same way, showing you when a price move might be getting overextended and is running out of gas.
Reading Overbought and Oversold Conditions
The most common way traders interpret the RSI is by watching two specific levels:
- Overbought: A reading above 70 often means that bullish enthusiasm is getting a bit frothy. It suggests the asset might be due for a price correction or at least a pause in its climb.
- Oversold: A reading below 30 signals that selling pressure has been intense. It indicates the price might be primed for a bounce or a short-term relief rally.
Here's a critical point many new traders miss: these are not automatic buy or sell signals. One of the biggest mistakes you can make is blindly selling the moment RSI hits 70 or buying as soon as it dips below 30. In a market with a powerful trend, an asset can stay "overbought" for a surprisingly long time while the price just keeps pushing higher.
Actionable Example: You see Solana's RSI dip to 25. Instead of immediately buying, you should wait. The actionable insight is to see how the next price candle forms. Does it show a rejection of the low (a long wick at the bottom)? Do you see buying volume increase? Use the RSI's oversold reading as an alert, not a command.
Finding Early Warnings with RSI Divergence
Just like with the MACD, divergence is where the RSI really shines. It can give you a heads-up that a trend might be about to turn, often well before the price chart gives you any obvious clues.
Let’s walk through a real-world scenario. Imagine a coin is carving out a series of higher highs on its price chart—a textbook uptrend. But when you glance down at the RSI indicator, you see it's making lower highs. This is a classic case of bearish divergence.
This disconnect tells a powerful story. Even though the price is still inching up, the actual strength and conviction behind those moves are fading. It’s a clear warning that the bulls are getting tired and a reversal or a significant pullback could be right around the corner.
On the flip side, bullish divergence happens when the price makes lower lows, but the RSI prints higher lows. This tells you that despite the falling price, the downward momentum is drying up, and a bounce could be coming soon. Learning to spot these divergences is a massive part of using the MACD and RSI together to get the full picture.
Why Combining MACD and RSI Creates a Powerful Strategy
Relying on just one technical indicator is a bit like sailing with only a compass. You know which way you're headed, but you have no idea how fast you're moving or if a storm is brewing on the horizon. This is precisely why pairing the MACD and RSI is such a powerful move for crypto traders.
Think of them as a team. The MACD is your navigator, giving you the big picture on the market's trend and underlying momentum. At the same time, the RSI is your immediate conditions expert, measuring the current speed and intensity of price action to warn you if things are getting overextended.
This teamwork creates a potent confirmation system. By waiting for both indicators to agree, you can filter out a ton of market noise and sidestep the false signals that plague the volatile crypto markets. It’s a disciplined approach that forces you to wait for setups with a much higher probability of success.
Avoiding Common Trading Traps
A classic mistake traders make is seeing an oversold RSI reading (below 30) and immediately jumping in to buy, thinking a rebound is guaranteed. But in a powerful downtrend, an asset can stay "oversold" for a surprisingly long time as its price keeps dropping. It's a textbook bull trap.
The MACD and RSI combo helps you dodge this trap. If the RSI is screaming oversold but the MACD still shows strong bearish momentum (with the MACD line way below its signal line), you know to keep your hands in your pockets. Your navigator is telling you the storm isn't over, even if the speedometer is hitting rock bottom.
Actionable Example: Imagine a coin's RSI is at 22, a deeply oversold level. You're tempted to buy. But you check the MACD, and the histogram bars are getting longer to the downside, and the MACD line is well below the signal line. This combination tells you to wait. The actionable insight is to hold off until the MACD histogram starts shrinking, signaling that the bearish momentum is finally weakening.
Building a High-Confidence Signal
So, what does a solid trade signal look like with this duo? You’re looking for a clear sequence where one indicator validates the other.
A high-probability entry happens when MACD's trend signal aligns with RSI's momentum reading. For instance, a bullish MACD crossover becomes much more convincing when the RSI confirms it by climbing out of oversold territory and crossing above the 30 level.
This layered confirmation isn't just theory; it has a real statistical edge. One detailed backtest of an integrated strategy produced impressive results. Across 235 trades, combining the MACD and RSI with a mean reversion filter hit an average 73% win rate. This highlights the practical value of demanding that your indicators work together. You can dive into the full research on this MACD and RSI strategy to see the data for yourself.
Finding Actionable Trade Setups with MACD and RSI
Theory is one thing, but seeing how the MACD and RSI play together on a live chart is where the real learning happens. Let’s shift from concepts to concrete examples and walk through two different trading scenarios: a multi-day swing trade and a fast-paced intraday setup. We'll break down the entire process, from spotting the initial signal to planning the trade.
Think of it like a simple confirmation checklist. An initial signal from the MACD is your first green light, but you always wait for the RSI to give the final go-ahead. This two-step process is crucial for weeding out false signals.
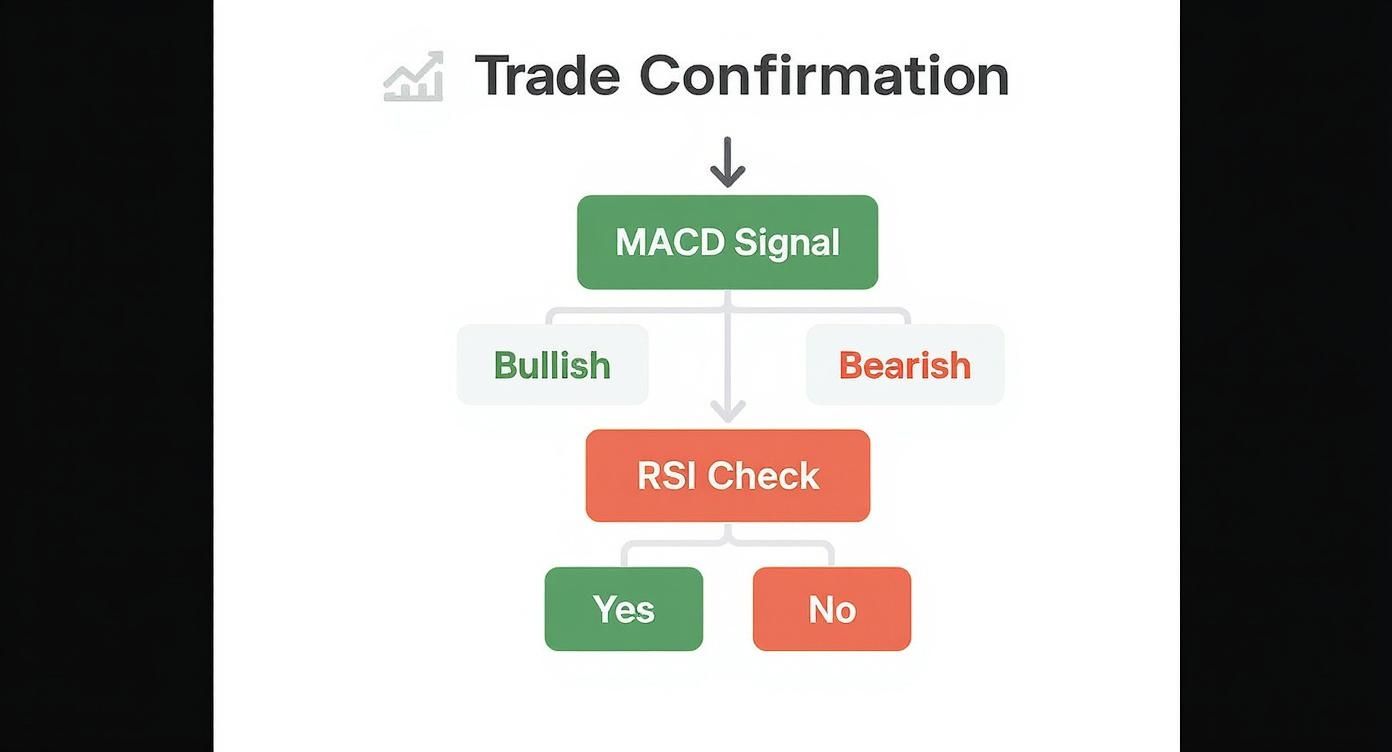
The main idea here is that a trade setup only becomes high-probability when both indicators are telling you the same story. This simple filter helps you avoid weak or conflicting setups that can drain your account.
Swing Trading Example: A Bullish Setup
When we're swing trading, we're camping out on higher timeframes like the daily chart. The goal isn't to catch every little wiggle but to capture the big, multi-day market moves. We want to find a new uptrend just as it’s starting and ride it for a solid gain.
Here’s how a bullish swing trade might unfold, step-by-step:
- Spot the MACD Signal: The first thing that catches our eye is a bullish crossover on the daily chart. This is our initial alert that upward momentum might be building, as the faster MACD line has just crossed above the slower signal line.
- Look for RSI Confirmation: A crossover by itself isn't enough to risk capital. We immediately glance at the RSI. For a strong entry, we need to see the RSI push above 50. This tells us the bulls have officially taken control of the momentum, giving us the confirmation we need.
- Plan the Entry and Manage Risk: Once both indicators are aligned, we can plan our entry, typically on the close of the candle where the confirmation occurred. A stop-loss goes below a recent swing low—our safety net in case of a reversal. The take-profit target could be a well-defined resistance level or the next bearish MACD crossover.
Waiting for the RSI to back up the MACD crossover is the secret sauce. It keeps you from getting faked out by "false starts"—those moments when momentum looks like it's picking up but ultimately fizzles out. This discipline is what separates a consistently profitable trader from one who chases every blip on the screen.
Intraday Trading Example: A Bearish Setup
Now, let's zoom in. For an intraday trade, we're living on the lower timeframes, like the 15-minute chart. The goal here is speed—capitalizing on a short-term burst of weakness. Divergence is often our go-to signal in this environment.
Here's how we might stalk a bearish intraday trade:
- Find the Bearish Divergence: Our primary signal is a classic bearish divergence on the MACD. This happens when the crypto's price grinds out a higher high, but the MACD histogram or line makes a lower high. It’s a huge red flag that the upward push is running out of steam.
- Confirm with an Overbought RSI: With the divergence spotted, we check the RSI. The perfect setup is seeing the RSI deep in overbought territory (above 70). This confirms that the price is stretched way too thin and is vulnerable to a snap-back.
- Execute the Short Trade: The entry is triggered on the candle close after the divergence is fully formed and confirmed. We’d place a tight stop-loss just above the recent price high to manage risk. Take-profit targets could be the next support level down or a dip into oversold RSI territory.
To make this process even clearer, here’s a quick checklist you can use to validate your trade ideas before you enter.
MACD and RSI Trade Setup Checklist
This simple table provides a quick reference for confirming high-probability bullish and bearish trade entries. A "Go" signal in every box for your chosen direction is what you're looking for.
| Checklist Item | Bullish Entry Signal | Bearish Entry Signal |
|---|---|---|
| MACD Signal | Bullish Crossover (MACD line > Signal line) OR Bullish Divergence | Bearish Crossover (MACD line < Signal line) OR Bearish Divergence |
| RSI Confirmation | Crosses above 50, showing bullish momentum | Crosses below 50, showing bearish momentum |
| RSI Context | Moving out of oversold (<30) territory is an even stronger signal | Moving out of overbought (>70) territory is an even stronger signal |
| Final Check | All signals align? Go. | All signals align? Go. |
This checklist isn't meant to be a rigid set of rules, but rather a mental framework to ensure you're only taking trades where the evidence is stacked in your favor.
How to Adapt Your Strategy for Different Market Conditions
One of the biggest mistakes traders make is sticking to one rigid strategy no matter what the market is doing. The powerful MACD and RSI combination isn't a silver bullet; its effectiveness changes drastically depending on the market’s mood. To trade consistently, you have to learn how to read the room and know which indicator to lean on.
Smart adaptation is all about recognizing the difference between a strong trend, a choppy sideways range, or a period of wild volatility. Each environment demands a different game plan if you want to dodge false signals and jump on real opportunities.
Thriving in Trending Markets
When a cryptocurrency is making a clear move up or down, the MACD is your best friend. In a strong trend, momentum is king. That makes MACD crossovers the most reliable signals for getting into trades that flow with the current.
Think about it: during a massive bull run, the RSI could scream "overbought" for weeks on end. If you listened to it, you'd sell way too early and watch the price keep climbing without you. Instead, you should be looking for bullish MACD crossovers to confirm that the upward momentum is still going strong.
Actionable Example: During the last major bull market, Bitcoin's RSI stayed above 70 for nearly a month. Traders who sold based on the RSI missed huge gains. The actionable insight is that in a strong uptrend, you should ignore overbought RSI signals and instead use bullish MACD crossovers on the daily chart as potential "buy the dip" or "add to position" opportunities.
Winning in Ranging Markets
Now, when the market is just bouncing between a clear floor (support) and ceiling (resistance), the roles are completely reversed. In these choppy, range-bound conditions, MACD crossovers are next to useless. They'll just whip you in and out of trades, generating one frustrating fakeout after another.
This is where the RSI really shines.
Actionable Example: Suppose Ethereum is trading between $2,800 (support) and $3,200 (resistance). The MACD gives you several false crossovers in the middle of the range. The actionable play is to ignore the MACD and watch the RSI. When the price touches $2,800 and the RSI dips below 30, it's a strong signal to buy. Conversely, as the price approaches $3,200 and the RSI moves above 70, it's a signal to sell.
Navigating High Volatility
During those crazy periods—maybe right after a big news announcement or a flash crash—both indicators can get a bit wild. Prices are swinging erratically, and momentum can flip on a dime. In these chaotic moments, the smartest move is often to tighten your settings or simply step aside and wait for the dust to settle.
If you absolutely must trade in this environment, try making a few tweaks:
- Faster Settings: Day traders might switch to quicker MACD settings (like 5, 13, 5 instead of the standard 12, 26, 9) to make the indicator react faster to sudden price shifts.
- Focus on Divergence: Volatile moves often end with a clear divergence signal. Keep an eye out for MACD or RSI divergence as a clue that the chaotic price action is running out of steam.
Answering Your Questions About Trading with MACD and RSI
Theory is one thing, but putting a strategy to work in a live market is where the real questions pop up. Let's tackle some of the most common hurdles traders face when using the MACD and RSI combo so you can trade with more confidence.
Can This Strategy Be Used for Day Trading?
Absolutely. The MACD and RSI partnership is incredibly versatile and works well for day trading, but you'll need to tweak your perspective. You're not looking at daily or 4-hour charts anymore; your focus will shift to much shorter timeframes, like the 5-minute or 15-minute charts.
For these quick intraday moves, the RSI often takes the lead. It's fantastic at catching those rapid overbought or oversold flashes that can signal a swift reversal. The MACD then plays a supporting role, acting as your momentum confirmation. You want to make sure you aren't trying to catch a falling knife.
Actionable Example: You're watching the 5-minute chart of a volatile altcoin. The RSI drops below 30, signaling it's oversold. Instead of buying immediately, you wait. Two candles later, the MACD line crosses above its signal line. That's your actionable entry signal to go long, with a tight stop-loss below the recent low.
What Are the Best Settings to Use?
Honestly, for most traders—especially if you're swing trading on the 4-hour or daily charts—the default settings are your best bet. Don't overcomplicate it.
- MACD: 12, 26, 9 (This means a 12-period EMA, a 26-period EMA, and a 9-period signal line)
- RSI: 14-period
These numbers aren't random; they've stood the test of time across decades of market analysis. They offer a great balance, making the indicators responsive enough to catch moves without being so sensitive that they give you constant false signals. While some expert scalpers might fine-tune them for ultra-short timeframes, you should master the standard settings first. Changing them without a solid, tested reason usually just adds more noise to your chart.
The real magic isn't in finding some "secret" setting. It's in deeply understanding how these two standard tools work together to give you a much clearer read on what the market is actually doing.
Do MACD and RSI Work for All Cryptocurrencies?
This is a great question. While the underlying principles of trend and momentum are universal, the reliability of these indicators shines brightest on coins with high trading volume and deep liquidity—think Bitcoin (BTC) and Ethereum (ETH).
When you start looking at low-cap, thinly traded altcoins, technical indicators can get a bit shaky. These markets can be easily pushed around by a single large trade or manipulative bots, causing indicators to whip back and forth and generate confusing signals. Before you apply this strategy, always check the coin's liquidity. The more people trading an asset, the more trustworthy the data from your indicators will be.
Ready to stop reacting to the past and start anticipating the future? CryptoMox layers AI-powered price projections and conviction bands right onto your charts, showing you where the market might be heading next. Ditch the guesswork and start trading with a clear, repeatable edge. Start your 7-day trial at CryptoMox.ai.