CryptoMox Blog
Trading the Inverted Hammer Candlestick Pattern
When you're staring at a chart that's been bleeding red for days, a small but powerful signal can appear, hinting that the sellers might finally be running out of steam. This is the inverted hammer candlestick pattern—a technical analyst's heads-up that a bullish reversal could be just around the corner.
Visually, it looks just like its name suggests: a small candle body at the bottom with a long wick pointing straight up. It tells a story of buyers starting to test the waters, even if they don't win the battle just yet. But remember, this pattern is a sign of a potential change, and it always needs confirmation before you jump into a trade.
What Is an Inverted Hammer Candlestick Pattern?
Picture a market stuck in a clear downtrend. Sellers have been in full control, pushing prices down session after session. Then, seemingly out of nowhere, a different kind of candle forms. This is the inverted hammer, and it’s a crucial clue for any trader scouting for a bottom. It's an early warning that buying pressure is starting to bubble up beneath the surface.
Think of it as a tug-of-war. For a moment, the buyers grab the rope and pull with all their might, sending the price soaring and creating that long upper wick. But their strength fades, and by the end of the session, the sellers have dragged the price right back down near where it started. What’s left is a small body at the bottom and a long shadow reaching for the sky—the classic shape of an inverted hammer.
The Anatomy of the Pattern
While the shape is simple, it tells a complex story about the shifting mood of the market. To be sure you've spotted a true inverted hammer, you need to check off a few key features.
- A Preceding Downtrend: First and foremost, this pattern is only valid if it shows up after a sustained price drop. Context is everything. Example: If Bitcoin has dropped from $70,000 to $65,000 over several days, an inverted hammer at this level is significant. The same shape during sideways chop around $68,000 is meaningless.
- A Small Real Body: The candle's body—the part between the open and close—should be small. Whether it's green or red doesn't matter as much as its size and position.
- A Long Upper Wick: This is the most critical part. The upper wick needs to be at least twice the length of the real body, showcasing that significant but failed attempt by the bulls. Actionable Insight: Use your charting tool's ruler. If the body is 100 points high, the wick must be at least 200 points. Eyeballing it can lead to mistakes.
- Little to No Lower Wick: There should be a tiny, almost non-existent lower shadow. This shows sellers couldn't push the price any lower than where it opened.
This structure makes it fundamentally different from a pattern like the Doji, which signals pure indecision. A Doji shows a stalemate between buyers and sellers. The inverted hammer, on the other hand, highlights a bold (though unsuccessful) push from buyers. You can dive deeper into these differences in our complete guide on the Doji candlestick.
To make identification easier, here's a quick checklist to keep handy.
Inverted Hammer Pattern Identification Checklist
This table breaks down exactly what to look for when you think you've spotted an inverted hammer on your charts.
| Characteristic | What to Look For | Why It Matters |
|---|---|---|
| Market Context | A clear and established downtrend. | The pattern is a reversal signal; it has no meaning in an uptrend or sideways market. |
| Real Body Size | Small and located at the bottom of the trading range. | A small body shows that the closing price was very close to the opening price. |
| Upper Wick Length | The wick is at least 2x the height of the real body. | This long wick represents the buyers' attempt to drive prices higher during the session. |
| Lower Wick Length | Very small or non-existent. | It shows that sellers were unable to push the price down past the session's open. |
Using this checklist helps you filter out look-alikes and focus only on high-probability setups, ensuring the story the candle tells aligns with the rules of the pattern.
Why It Signals a Potential Reversal
The inverted hammer is a rare sight, which is part of what makes it so significant. Research shows it accounts for only about 0.40% of all candlestick occurrences, meaning when it does pop up, it’s worth paying attention to. Its unique anatomy captures that exact moment when a relentless downtrend first encounters real, organized buying pressure.
This suggests the bears are losing their grip. If you want to dig into the data behind this, you can check out the research on top reversal candlestick patterns.
Key Takeaway: The inverted hammer is not a green light to buy. Think of it as a yellow flag. It’s a warning shot to sellers that the game is changing, and it tells smart traders to get ready for a potential upward move that could be just one or two candles away.
Understanding the Battle Between Buyers and Sellers
Every candlestick on your chart tells a story—a small but fierce battle between buyers and sellers over a set period. The inverted hammer pattern is one of the most dramatic tales, capturing that critical moment when a downtrend's sellers suddenly get a shocking pushback from buyers. It’s a plot twist in the market's ongoing narrative.
Imagine a market where sellers have been running the show, shoving prices lower and lower. In this downtrend, the mood is gloomy, and sellers are feeling pretty confident. Then, out of nowhere, something shifts. The session opens, and buyers, who've been sitting on the sidelines, suddenly charge in with surprising force.
This burst of buying pressure sends the price soaring, creating the long upper wick (or shadow) of the inverted hammer. This wick is the proof—the visual evidence of the bulls trying to take back control. For a brief moment, it feels like the tide is finally turning.
The Sellers' Final Push
But the established downtrend has inertia. The sellers, caught off guard by this bullish assault, fight back hard. They manage to wrestle the price all the way back down, forcing it to close near where it opened. This successful counter-move is what forms the small real body at the bottom of the candle.
Even though sellers technically won the session by preventing a higher close, the psychological damage is done. That long upper wick is left behind like a scar, a permanent reminder of the buyers' new strength. It’s a warning shot.
Key Insight: The inverted hammer shows that the sellers’ grip on the market is slipping. The fact that aggressive buyers even showed up—despite being pushed back—signals that the downtrend’s foundation is starting to crack.
This shift in psychology is precisely what makes the inverted hammer candlestick pattern so powerful. It’s not just a shape on a chart; it’s the footprint of a struggle. Sellers are still in the game, but their dominance is weakening. Meanwhile, buyers have just shown they're ready and willing to step in at these prices. This is often the first hint of accumulation, where smart money starts quietly building positions. You can dive deeper into these phases by understanding the mechanics of Wyckoff distribution patterns.
What This Power Shift Means for Traders
Reading this battle correctly is everything. When you spot an inverted hammer, it should immediately put you on high alert for a potential change in trend. It’s your cue to question the bearish momentum and start looking for bullish setups.
Think about the psychology at play here:
- Seller Exhaustion: The sellers had to burn a lot of energy to force the price back down. That could have been their last big push before they run out of steam.
- Buyer Confidence: The fact that buyers could rally the price so high, even if it didn't stick, shows they’re gaining conviction and see value at these levels.
- A Test of Strength: The entire session was a probe. The bulls tested the sellers' defenses and discovered they weren't as strong as everyone thought.
This whole dynamic sets the stage for what comes next. The inverted hammer isn't a buy signal on its own, but it's the perfect setup for a reversal. The real tell is what happens in the next candle. If buyers can follow through and push the price above the inverted hammer's high, it’s the confirmation you’re looking for—the power has officially changed hands.
How to Confirm the Inverted Hammer Signal
Seeing an inverted hammer on your chart is like hearing a rumble in the distance—it signals a potential change, but you don't act on the sound alone. It's a sign that the bears are losing their grip, but it's not a guarantee the bulls are ready to charge. Jumping in too early is a classic mistake that gets traders caught in false reversals.
The real key is waiting for confirmation. Confirmation is the market's way of showing you that the buyers who tested the waters with the inverted hammer have come back with a full-blown rescue party. It’s the proof you need that the initial push wasn't just a one-off event. Without it, you're just gambling on a reversal.
This infographic breaks down the tug-of-war between buyers and sellers that creates the inverted hammer, from the initial downtrend to the moment sellers start to falter.
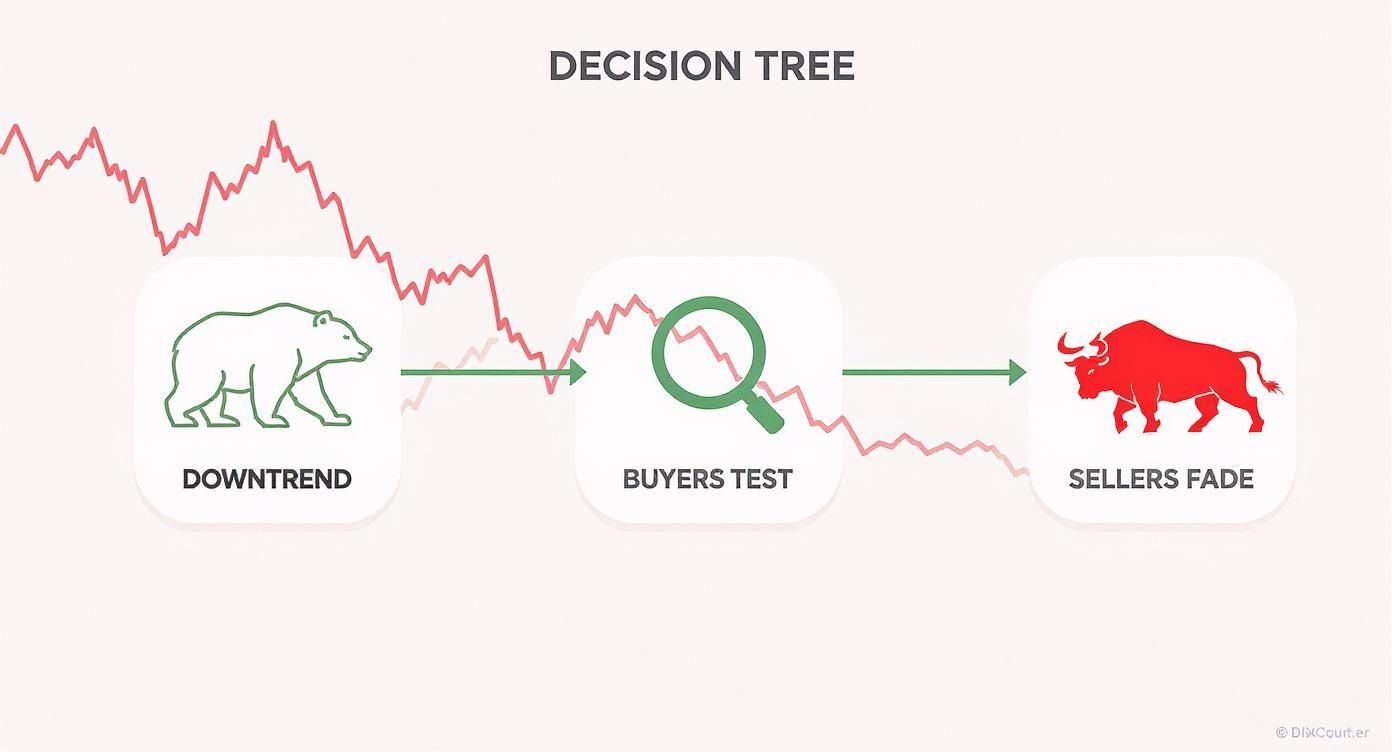
As you can see, the story starts with sellers firmly in charge, but then buyers make a stand. By the end of the candle, the sellers' power has noticeably weakened, setting the stage for the bulls to take over.
The Three Rules for Validating the Signal
To trade the inverted hammer with any degree of confidence, you need a simple, non-negotiable checklist. Think of it as your pre-trade ritual. Skipping even one of these steps is like flying blind.
- Confirm the Downtrend: First things first, this is a bullish reversal pattern. That means it can only happen at the bottom of a clear downtrend. If you spot this shape in a sideways market or an uptrend, it's not an inverted hammer. It's probably a shooting star, which signals the exact opposite. Context is everything.
- Check the Anatomy: Make sure the candle fits the bill. Does the upper wick stretch at least twice the length of the small body? Is the lower wick tiny or non-existent? This specific shape tells the critical story of buyers pushing up hard before sellers managed a weak push back down.
- Wait for the Confirmation Candle: This is the make-or-break step, and it requires patience. A real reversal needs follow-through. The very next candle must be a strong, bullish candle that closes above the high of the inverted hammer. This is the market screaming that the buyers have officially taken control.
Trader's Edge: Never, ever enter a trade on the inverted hammer candle itself. That's pure speculation. Your job is to wait for the next candle to close. A solid green candle closing above the high of the inverted hammer is your green light.
Building a Stronger Case with Confluence
While those three rules give you a solid starting point, seasoned traders know better than to rely on a single signal. We look for confluence—multiple, independent signs all pointing to the same conclusion. It's like having several expert witnesses all telling the same story.
Here are a few of the most powerful confluence factors to stack in your favor:
- Key Support Levels: An inverted hammer is a good sign. An inverted hammer forming right on top of a historical support zone, a major trendline, or a critical Fibonacci level? That's a great sign. Example: If SOL is dropping and an inverted hammer forms exactly at the $120 support level that held multiple times last month, its significance skyrockets.
- A Spike in Volume: Look at the volume bar for the inverted hammer candle. If you see a noticeable spike, it tells you a significant battle took place. High volume means high participation and conviction, which adds serious weight to the reversal signal.
- Bullish Divergence: This is a classic. Check your momentum oscillators like the RSI or MACD. If price is grinding to a new low but your indicator is making a higher low, you've got bullish divergence. It’s a huge clue that the downward momentum is fading fast. Our guide on using MACD and RSI together shows exactly how to spot these powerful setups.
- Moving Averages: If the pattern appears near a major long-term moving average (like the 200 EMA) that has historically propped up the price, it adds another layer of defense for the bulls.
When you combine the inverted hammer with proper confirmation and risk management, its reliability gets a serious boost. Backtesting data shows that with the right confirming signals, the pattern can produce a win rate between 60% to 70%. You can dig deeper into these reliability findings on TraderVue.
Practical Inverted Hammer Trading Strategies
Spotting a pattern is one thing; actually making money from it is another ballgame entirely. To turn the inverted hammer into a reliable tool, you need a disciplined game plan. Once you’ve confirmed the pattern, you need to know exactly where you’re getting in, where you’re getting out if you're wrong, and where you'll take your profits.
This framework is what separates consistent traders from gamblers. It takes the guesswork and emotion out of the equation, forcing you to define your risk and reward before a single dollar is on the line. In the wild west of crypto, that’s not just good practice—it’s how you survive.
Building Your Crypto Trade Setup
Executing a trade on an inverted hammer candlestick pattern boils down to three critical steps. Think of it like building a house: you need a solid foundation (your entry), strong walls (your stop-loss), and a roof (your profit target). Each part is essential for a sound structure.
Here’s a step-by-step breakdown you can use for any inverted hammer setup:
- Define Your Entry Point: Don't just jump in when you see the pattern. The professional move is to wait for the confirmation candle to close. Place a buy-stop order just a few ticks above the high of that confirmation candle. This proves the bulls are actually in control and you're not just catching a falling knife.
- Set Your Stop-Loss: This is your eject button. Your stop-loss goes just below the low of the inverted hammer candle itself. This is your line in the sand. If the price breaks below this point, the reversal signal is dead, and you get out with a small, pre-defined loss.
- Establish Your Profit Targets: Know where you’re going before you start the journey. A solid rule of thumb is to aim for a 1:2 risk-to-reward ratio. If your stop-loss is $100 away from your entry, your first target should be $200 above it. Another popular method is to target the next major resistance level you see on the chart.
Pro Tip: Once your trade is live, never, ever move your stop-loss further down to give the trade "more room." That's a rookie mistake. Your first job is to protect your capital, always.
This methodical approach makes trading a repeatable process, not a gut-feeling gamble.
Real-World Example on an Ethereum Chart
Let's walk through a real-world scenario. Imagine Ethereum (ETH) has been bleeding out for days, grinding down on the 4-hour chart. The price is finally approaching a major support zone around $3,000, a level everyone is watching.
Right on that support line, an inverted hammer forms. You notice the volume is a bit higher than usual, which tells you a real fight is happening. Now you have a high-probability setup on your hands.
- The Setup: An inverted hammer pops up at the key $3,000 support level. The low is $2,950 and the high is $3,025.
- The Confirmation: The very next 4-hour candle is a big green one, closing strong at $3,075, well above the inverted hammer's high of $3,025. This is your green light.
- The Entry: You place your buy order at $3,076, just above the close of the confirmation candle.
- The Stop-Loss: The low of the inverted hammer was $2,950. You set your stop-loss at $2,949. Your total risk is $127 per ETH ($3,076 - $2,949).
- The Profit Target: Using our 1:2 risk-to-reward ratio, you're targeting a gain of $254 ($127 x 2). You set a take-profit order at $3,330 ($3,076 + $254).
By following these steps, you’ve entered a trade with a crystal-clear plan. No emotions, no panic—just pure execution.
Timeframe Considerations and Statistical Edge
The timeframe you trade on matters. The inverted hammer doesn't behave the same on a weekly chart as it does on a 30-minute chart. Interestingly, extensive backtesting of candlestick patterns in forex markets gives us some clues. One study found that on a 30-minute chart, an inverted hammer led to a bullish reversal 52.9% of the time.
While that's not a massive edge, it's a consistent, statistical advantage you can lean on, especially in short-term trading. Curiously, that same study showed that waiting for a confirmation candle actually lowered the success rate slightly to 51.9%. If you want to dive into the numbers yourself, you can review the detailed research on candlestick performance here.
Advanced Risk Management and Position Sizing
Let's be honest: not all inverted hammer patterns are created equal. Some pop up at the perfect spot, aligning with every technical factor you could hope for and practically screaming that a reversal is coming. Others just kind of… show up in the middle of a messy, directionless chart.
The real difference between a trader who makes it and one who doesn't often boils down to one simple skill: knowing how to tell a high-probability setup from a dud and betting accordingly.
Advanced risk management isn't just about throwing a stop-loss on every trade. It's about being dynamic. It means you risk more when the stars align and pull way back when a setup looks questionable. This isn't just a defensive move; it's how you protect your capital and actually grow your account over the long haul.
How Strong is the Signal, Really?
Think of yourself as a detective building a case for a bullish reversal. The inverted hammer is your first big clue—it's a great start, but it won’t win the case on its own. You need more evidence. The more supporting facts you can gather, the stronger your "case" becomes, and the more conviction you can have in the trade.
Here are the key pieces of evidence I always look for:
- Location, Location, Location: Where did this pattern show up? An inverted hammer at a major support level, a long-term trendline, or a key Fibonacci zone is infinitely more powerful than one just floating in no-man's land.
- Volume Confirmation: Look at the volume bar for that inverted hammer candle. Was there a noticeable spike? Big volume tells you a real fight happened between buyers and sellers, and the buyers made a statement. Low volume? That’s more like a half-hearted push that’s likely to get run over.
- The Bigger Picture: What's the rest of the market doing? Trying to catch a bottom with an inverted hammer while the rest of the market is in a freefall is a low-percentage play. But if the broader market (like Bitcoin) is also showing signs of life, your odds improve dramatically.
By running through this quick checklist, you move beyond just seeing a pattern to actually qualifying it. This is the first step to sizing your positions like a pro.
Building Your Conviction-Based Sizing Model
Once you can tell an A+ setup from a C- setup, the next step is to link that grade directly to how much money you put on the line. A conviction-based model is just a simple framework that takes the emotion out of the equation. You decide the rules ahead of time.
You could create a simple three-tiered system like this:
- High-Conviction Setups (Risk 2% of Account): These are the home runs. The inverted hammer appears at rock-solid support, gets confirmed with huge volume, and you even spot some bullish divergence on the RSI. Every box is checked. Go for it.
- Medium-Conviction Setups (Risk 1% of Account): These are solid, but maybe not perfect. Maybe the pattern formed near support but the volume was just average. Or perhaps the confirmation candle that followed wasn't as explosive as you'd like.
- Low-Conviction Setups (Risk 0.5% or No Trade): These are weak signals. The pattern might be in a choppy, sideways market with no clear support and pathetic volume. Honestly, these are the trades you should probably just skip. Preserving your capital for a better opportunity is a winning move in itself.
Key Takeaway: Sizing your positions based on conviction ensures your biggest wins come from your best ideas, while any losses from the weaker signals are just small papercuts. This is a cornerstone of professional trading.
Here’s a simple table to help visualize how you might structure this.
Conviction-Based Position Sizing Model
This sample framework shows how you can systematically adjust your risk based on the confidence you have in an inverted hammer signal.
| Confidence Score | Signal Strength | Suggested Position Size (% of Account) | Example Indicators |
|---|---|---|---|
| 8-10 / 10 | High-Conviction | 1.5% - 2.0% | Forms at major support, high volume spike, bullish divergence on RSI. |
| 5-7 / 10 | Medium-Conviction | 0.75% - 1.0% | Forms near minor support, average volume, no divergence. |
| 1-4 / 10 | Low-Conviction | 0.5% or No Trade | No clear support, low volume, appears in a choppy market. |
Adopting a structured approach like this turns trading from a guessing game into a methodical process. It forces you to be selective and only commit serious capital when the evidence is overwhelmingly on your side.
This is especially critical when trading something as nuanced as the inverted hammer candlestick pattern. Tools that offer forward-looking analysis, like CryptoMox, can help sharpen this process even further by providing confidence scores and conviction bands to help you quantify a setup's potential strength before you pull the trigger.
Common Trading Mistakes to Avoid
Spotting an inverted hammer is one thing; trading it profitably is another ballgame entirely. Knowing what to do is only half the battle. Just as crucial is knowing what not to do.
Too many traders, especially when they're new to the crypto space, fall into the same traps. These simple, preventable errors can quickly turn a high-probability setup into a frustrating loss. Let's walk through the biggest pitfalls so you can sidestep them from day one.
Trading Without the Right Context
This is the big one. The single most common mistake I see is traders ignoring market context. Remember, the inverted hammer is a bullish reversal pattern. The keyword there is "reversal"—it only makes sense if it shows up at the bottom of a clear downtrend.
- The Mistake: Firing off a trade when an inverted hammer shape appears in a sideways, choppy market or, even worse, during an uptrend.
- Why It's a Problem: That same shape in an uptrend is a "shooting star," which is a classic bearish signal. You’d be betting on a move up when the chart is screaming for a move down. It's a recipe for disaster.
- The Rule: Always confirm a clear, preceding downtrend. If the price hasn't been falling, it’s not an inverted hammer. It's just a candle.
Jumping the Gun on Confirmation
Patience is a trader's superpower, but it's tough to master. The moment you spot a potential bottom, the urge to jump in can be overwhelming. This is where discipline separates the pros from the rest.
Trader's Reality Check: An inverted hammer is a signal of a potential change in momentum, not a guarantee. It tells you buyers showed up and fought back, but the session still closed weak. The real proof is in what happens next.
- The Mistake: Entering a long position the second the inverted hammer candle closes, without waiting to see what the next candle does.
- Why It's a Problem: The sellers who pushed the price down from its high could still be in control. They might just keep selling on the next candle, instantly invalidating the signal and hitting your stop.
- The Rule: Wait for a confirmation candle to close. Your real green light is a strong bullish candle that closes above the high of the inverted hammer. That’s your proof.
Setting Your Stop-Loss Too Tight
We all know risk management is critical, but there’s a fine line between being prudent and strangling your trade. Setting your stop-loss too close to your entry in the volatile crypto market is a surefire way to get knocked out of a perfectly good trade.
- The Mistake: Placing the stop-loss just a few ticks below your entry or right at the inverted hammer's closing price.
- Why It's a Problem: A small, meaningless price dip—a common occurrence in crypto—can easily wick down and trigger your stop right before the real upward move begins. It's incredibly frustrating.
- The Rule: Set your stop-loss below the low of the inverted hammer candle. This level is your line in the sand. If the price breaks below that point, the entire bullish thesis is broken.
Answering Your Questions
Let's clear up a few common points of confusion that I see traders struggle with when it comes to the inverted hammer. Getting these details right will make a huge difference in how you read and react to the pattern.
Inverted Hammer vs. Shooting Star: What's the Real Difference?
This is the big one, and it’s a classic mistake. An inverted hammer and a shooting star look identical—a small body at the bottom with a long wick sticking straight up. The only thing that separates them is where they show up.
The inverted hammer appears after a downtrend. It’s a signal that buyers are finally testing the waters, hinting at a potential bottom. A shooting star, on the other hand, forms after an uptrend and signals the exact opposite—that sellers are starting to slam the door on the rally.
Context is everything here. The preceding trend tells you the entire story.
Can an Inverted Hammer Pop Up in an Uptrend?
Nope. If you see that same candle shape during a strong price rally, it's not an inverted hammer. It's a shooting star, and you need to pay attention. It's a warning sign that the buying pressure is fading and a reversal could be just around the corner. Mixing these two up is a surefire way to get caught on the wrong side of a trade.
How Reliable Is This Pattern on Its Own?
Honestly, trading an inverted hammer without waiting for confirmation is a gamble. By itself, the pattern just tells you that buyers tried to push the price up but couldn't hold the highs. It’s a flicker of hope, not a blazing green light.
The pattern becomes much more reliable when the next candle is a strong bullish one that closes above the inverted hammer's high. Without that follow-through, you're trading on a low-probability signal, which is a tough way to stay profitable.
What's the Best Timeframe for Trading Inverted Hammers?
As a general rule, the higher the timeframe, the more reliable the signal. An inverted hammer on a daily or 4-hour chart means a lot more than one on a 5-minute chart, where you get a ton of random noise.
For most crypto day traders, the 1-hour and 4-hour charts hit the sweet spot. They give you enough trading opportunities without the constant false signals you'd get on lower timeframes.
Stop letting emotion drive your trades and start executing with a clear, data-driven plan. CryptoMox puts AI-powered price projections and conviction scores right on your charts, helping you spot high-probability setups and manage your risk like a pro. See what the future of technical analysis looks like and start your 7-day trial at https://cryptomox.ai.