CryptoMox Blog
10 Best Technical Indicators for Swing Trading in 2025
Swing trading thrives on capturing multi-day market moves, but success demands more than just intuition. It requires a robust analytical toolkit, as choosing the right tools can be the difference between capitalizing on a trend and getting caught in market noise. This guide cuts through the clutter, presenting a comprehensive roundup of the best technical indicators for swing trading, specifically tailored for the popular 1-hour to 4-hour timeframes.
Instead of generic theory, you will find actionable strategies you can implement immediately. We will dive deep into each of the top 10 indicators, detailing everything from optimal parameter settings to precise entry and exit rules. You will learn not just what each tool does, but exactly how to interpret its signals to identify high-probability setups, set intelligent stop-loss orders, and effectively manage your trades to secure profits.
We will provide real-world examples and explore powerful indicator combinations that create a confluence of signals, significantly boosting your decision-making confidence. Furthermore, we will explore how to synergize these classic, time-tested tools with modern analytical platforms like CryptoMox. By integrating traditional indicators with CryptoMox's forward-looking price projections and confidence scores, you can move beyond reactive, lagging analysis and build a more predictive, proactive trading framework. This guide is designed to equip you with a complete, repeatable process for navigating the markets with greater clarity and precision.
1. Relative Strength Index (RSI)
The Relative Strength Index (RSI) is a classic momentum oscillator that measures the speed and magnitude of recent price changes to evaluate overbought or oversold conditions in the price of an asset. Developed by J. Welles Wilder Jr., it oscillates between 0 and 100, making it a staple for identifying potential trend reversals and entry points, which is why it's one of the best technical indicators for swing trading.

Traditionally, an RSI reading above 70 suggests an asset is overbought and may be due for a price correction, signaling a potential short entry. Conversely, a reading below 30 indicates it is oversold and could be primed for a rebound, presenting a long opportunity. This mean-reversion characteristic is invaluable for swing traders who aim to capture price "swings" over several days or weeks.
Practical Application for Swing Traders
Swing traders can leverage the RSI by looking for signals on 1-hour to 4-hour timeframes, which align perfectly with multi-day trade durations. For example, if a cryptocurrency is in a long-term uptrend but its 4-hour RSI crosses above 70, a trader might wait for the price to pull back to a key support level before entering a long position, using the overbought signal as a temporary caution flag rather than an outright short signal.
Key Insight: Divergence is the most powerful signal from the RSI. A bullish divergence occurs when the price makes a lower low, but the RSI makes a higher low. For example, if Bitcoin's price drops to $60,000 and then to $59,000, but the RSI moves from 25 to 28, it indicates weakening downward momentum and often precedes a significant upward move. This provides a high-probability long entry signal for swing traders.
Actionable RSI Strategies
- Parameter Settings: While the default setting is 14 periods, swing traders can adjust it. Use a setting of 7 for more sensitivity and earlier signals on shorter swings, or 21 for smoother signals that filter out market noise on longer swings.
- Confirmation with Price Action: Never trade on RSI signals alone. Confirm an overbought signal (RSI > 70) with a bearish chart pattern like a double top or a break below a key support level before entering a short position. For instance, if RSI is above 70 and the price forms a bearish engulfing candle at resistance, the short signal is much stronger.
- Integrating with CryptoMox: Enhance your RSI analysis by cross-referencing signals with CryptoMox's projections. If the RSI shows a bullish divergence on the 4-hour chart and CryptoMox projects a high-confidence upward trend for the next 24-48 hours, it significantly strengthens the case for a long entry. This combination helps validate RSI signals with forward-looking data.
2. Moving Average Convergence Divergence (MACD)
The Moving Average Convergence Divergence (MACD) is a versatile trend-following momentum indicator that reveals the relationship between two exponential moving averages (EMAs) of an asset's price. Created by Gerald Appel, it consists of the MACD line, the signal line, and a histogram. Because it excels at identifying changes in trend direction, strength, and momentum, it has secured its place as one of the best technical indicators for swing trading.
A bullish signal occurs when the MACD line crosses above its signal line, suggesting upward momentum is increasing. Conversely, a bearish signal is generated when the MACD line crosses below the signal line, indicating downward momentum is gaining traction. The histogram visually represents this relationship, growing larger as momentum accelerates and shrinking as it wanes, which is perfect for swing traders timing their entries and exits over several days.
Practical Application for Swing Traders
Swing traders find the MACD most effective on daily and 4-hour charts, as its signals align well with holding periods of several days to weeks. For example, if a cryptocurrency is in a clear uptrend and the MACD on the daily chart performs a bullish crossover above the signal line, a trader might enter a long position, targeting a key resistance level. The histogram's expansion would confirm the growing strength of the upward swing.
Key Insight: The zero-line crossover is a powerful trend confirmation signal. When the MACD line crosses above the zero line, it indicates that the shorter-term average is moving above the longer-term average, often confirming the start of a new, sustained uptrend. For instance, after a prolonged downtrend, seeing the daily MACD line cross above zero can signal the beginning of a multi-week bull run, providing a robust entry trigger for longer-duration swing trades.
Actionable MACD Strategies
- Parameter Settings: The standard setting is 12, 26, 9. For more sensitivity to capture shorter price swings, traders often use faster settings like 8, 17, 9. This adjustment helps generate earlier signals, which can be crucial in fast-moving crypto markets.
- Confirmation with Price Action: A MACD signal is strongest when confirmed by price action. If the MACD generates a bearish crossover while the price is simultaneously rejected at a major resistance level with a long-wicked candle, the probability of a successful short trade increases significantly.
- Integrating with CryptoMox: Validate MACD signals with predictive analytics. If the MACD on a 4-hour chart shows a bullish crossover and the CryptoMox projection indicates a high-confidence uptrend for the next 2-3 days, it provides powerful dual confirmation. This synergy helps filter out false signals and boosts trade conviction.
3. Bollinger Bands
Bollinger Bands are a versatile volatility indicator created by John Bollinger in the 1980s. They consist of three lines: a middle band (typically a 20-period simple moving average) and two outer bands set two standard deviations above and below the middle band. This construction allows them to dynamically adapt to market volatility, providing powerful insights into potential price levels and breakouts, making them one of the best technical indicators for swing trading.
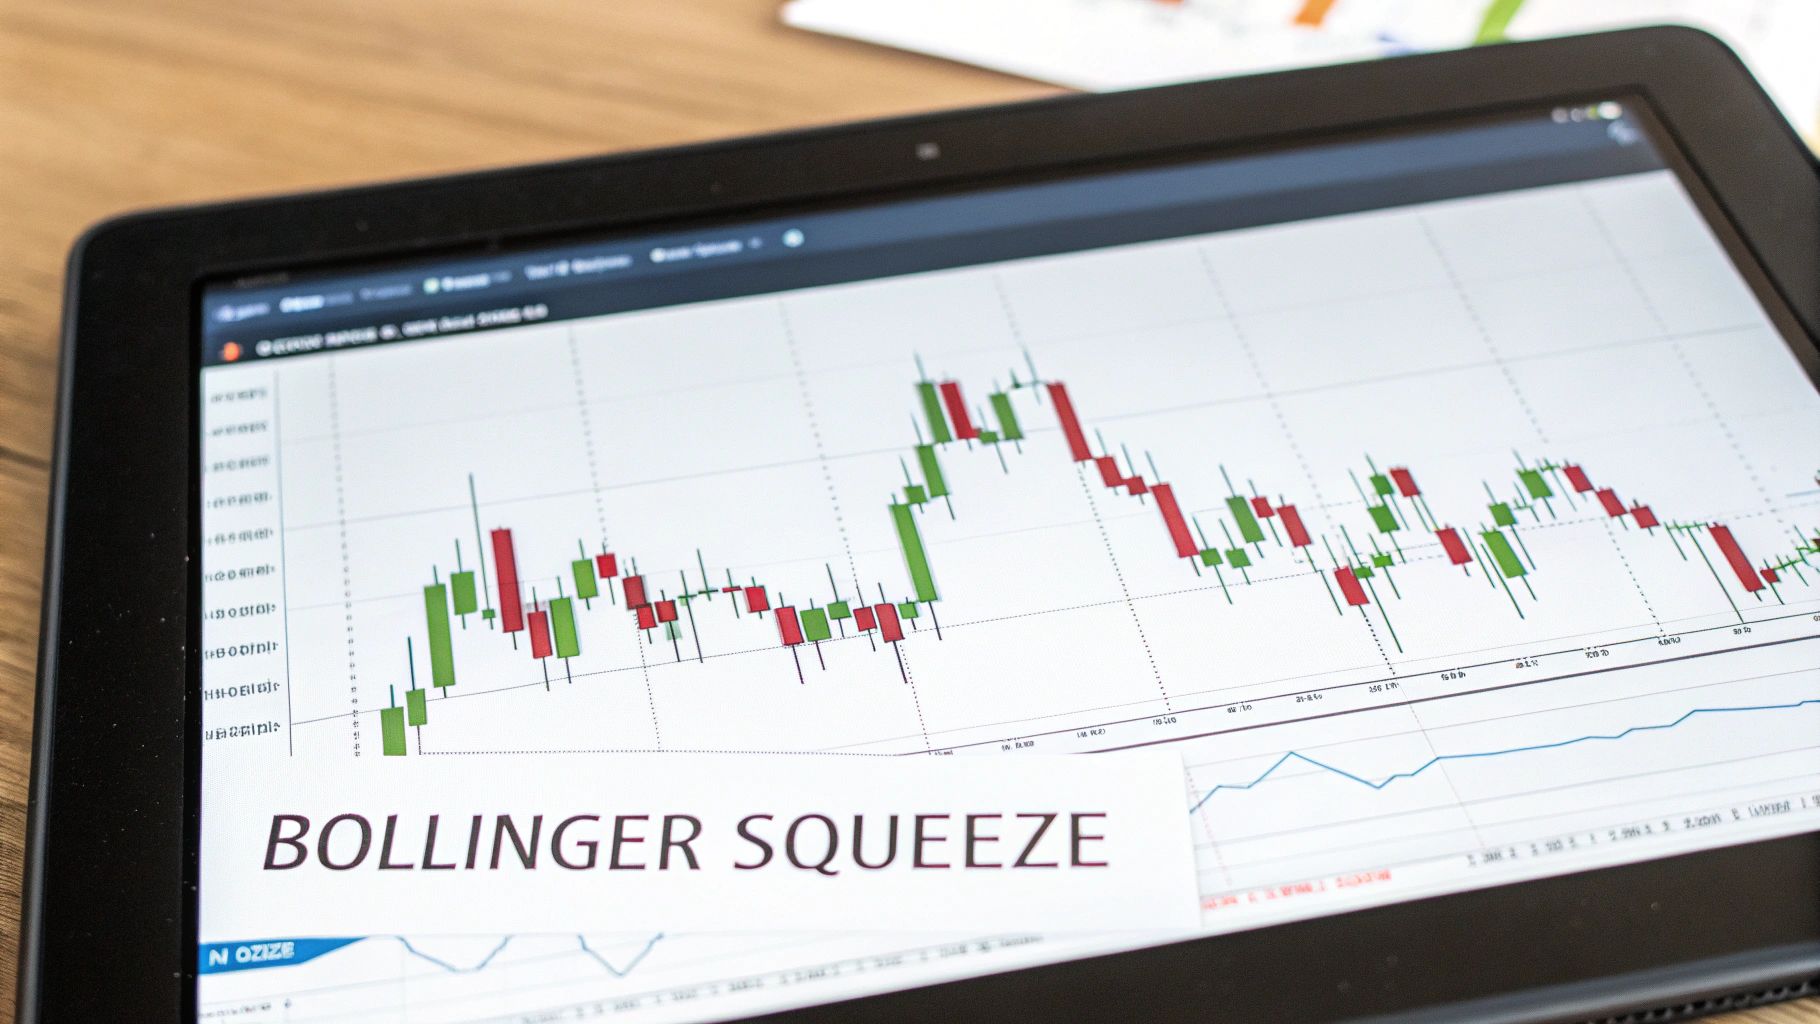
The bands widen when volatility increases and contract (or "squeeze") when volatility decreases. Swing traders use them to identify overextended prices ripe for a reversal. When the price touches the upper band, it's considered relatively high; when it touches the lower band, it's relatively low. This creates clear, dynamic support and resistance levels for planning entries and exits over a multi-day holding period.
Practical Application for Swing Traders
For swing trading, Bollinger Bands are exceptionally useful on the 1-hour and 4-hour charts. A classic strategy is the "Bollinger Bounce," where a trader enters a long position after the price touches the lower band and confirms a reversal with a bullish candlestick pattern. For example, if a stock in an uptrend pulls back and its 4-hour candle closes as a hammer pattern right on the lower band, it signals a high-probability entry point for a swing back toward the middle or upper band.
Key Insight: The Bollinger Squeeze is a precursor to a significant price move. When the bands contract tightly, it signals a period of low volatility that will inevitably be followed by a high-volatility breakout. For example, if you see the bands on a daily chart getting extremely narrow for several days, you can place an entry order to buy just above the upper band and an order to sell just below the lower band to catch the subsequent explosive move.
Actionable Bollinger Bands Strategies
- Parameter Settings: The standard setting is 20 periods with 2 standard deviations. For faster signals on shorter swings, consider a 10-period SMA with 1.5 standard deviations. For longer-term swings on the daily chart, a 50-period SMA with 2.5 standard deviations can help filter out noise.
- Confirmation with Oscillators: Combine band touches with an indicator like the RSI. A long entry is much stronger if the price touches the lower Bollinger Band while the RSI is simultaneously in oversold territory (below 30).
- Integrating with CryptoMox: Validate a Bollinger Squeeze breakout with CryptoMox projections. If the bands are squeezing on the 4-hour chart and CryptoMox issues a high-confidence projection for a strong upward move, it gives you a directional bias, allowing you to anticipate and trade the breakout with greater certainty.
4. Stochastic Oscillator
The Stochastic Oscillator is a momentum indicator that compares a particular closing price of an asset to its high-low range over a specified number of periods. Developed by George Lane in the 1950s, it operates on the principle that momentum precedes price. It oscillates between 0 and 100, making it one of the best technical indicators for swing trading to identify overbought and oversold conditions, especially in ranging markets.
The indicator consists of two lines: %K (the fast line) and %D (a moving average of %K, the slow line). Readings above 80 suggest an asset is overbought and potentially due for a downturn, while readings below 20 indicate it is oversold and may be poised for a rally. This is perfect for swing traders aiming to enter trades as momentum shifts at price extremes.
Practical Application for Swing Traders
Swing traders find the Stochastic Oscillator most effective on 1-hour to 4-hour charts for identifying entry points that align with multi-day holding periods. For instance, if a cryptocurrency is in a sideways channel, a swing trader could watch for the %K line to cross above the %D line while both are below the 20 level. This crossover signals building upward momentum and presents a potential long entry near the bottom of the range.
Key Insight: The most reliable Stochastic signals occur when combined with clear price structure. A bullish divergence at a key support level is a high-probability setup. For example, if the price of an asset hits $100, then drops to a new low of $98, but the Stochastic Oscillator moves from 15 up to 18, it signals fading downside momentum and a reversal is likely. This is a powerful buy signal at a support zone.
Actionable Stochastic Strategies
- Parameter Settings: The standard setting is (14, 3, 3) for the Slow Stochastic. For faster signals on shorter swings, traders can use a Fast Stochastic setting like (5, 3, 3). For longer-term swing trades that require less sensitivity, a setting of (21, 5, 5) can help filter out market noise.
- Confirmation with Crossovers: Don't act just because the indicator is below 20 or above 80. Wait for confirmation, such as the %K line crossing decisively above the %D line for a long signal or below it for a short signal, to validate the shift in momentum.
- Integrating with CryptoMox: Validate Stochastic signals with forward-looking data. If the Stochastic shows a bullish divergence below 20 on the 4-hour chart and CryptoMox projects a high-confidence rally over the next 24-48 hours, the trade's probability of success increases dramatically. This combines a classic momentum signal with predictive analytics for a more robust trading decision.
5. Average True Range (ATR)
The Average True Range (ATR) is a volatility indicator that measures how much an asset moves on average over a given time frame. Developed by J. Welles Wilder Jr., the ATR does not indicate price direction; instead, it purely expresses volatility in absolute terms, making it an indispensable risk management tool and one of the best technical indicators for swing trading.
A rising ATR signals increasing market volatility, suggesting wider price swings and potentially stronger breakouts. A falling ATR indicates decreasing volatility and a period of consolidation. For swing traders, this information is critical for setting realistic profit targets and, most importantly, placing effective stop-losses that adapt to current market conditions rather than arbitrary percentages.
Practical Application for Swing Traders
Swing traders use the ATR to dynamically adjust their risk. For example, if a cryptocurrency with a price of $50 has a 14-period ATR of $1.50 on the 4-hour chart, a trader might place their stop-loss at 2x the ATR below their entry price. This means setting a stop $3.00 below the entry, giving the trade enough room to withstand normal volatility without getting stopped out prematurely.
Key Insight: The ATR’s primary power is in position sizing and risk management. Instead of risking a fixed percentage, traders can risk a consistent dollar amount per trade by adjusting their position size based on volatility. For example, if you decide to risk $100 per trade and the ATR-based stop-loss distance is $2, you can buy 50 shares. If another stock has a stop-loss distance of $5, you would only buy 20 shares, ensuring your dollar risk remains the same.
Actionable ATR Strategies
- Stop-Loss Placement: A common rule is to set your initial stop-loss 1.5 to 2.5 times the ATR away from your entry price. For a long position, place it below entry; for a short, place it above.
- Dynamic Position Sizing: Calculate your position size using this formula: Position Size = Account Risk Amount / (Stop-Loss Multiplier × ATR). This ensures your risk is consistent across trades in different assets and volatility environments.
- Integrating with CryptoMox: Use the ATR to validate breakout potential. If you see a high-confidence breakout projection on CryptoMox, check the ATR. A rising ATR leading into the projected breakout confirms increasing momentum and strengthens the signal, suggesting the move has the volatility needed to succeed.
6. Fibonacci Retracement Levels
Fibonacci Retracement is not an indicator in the traditional sense, but a timeless tool used to identify potential support and resistance levels. It involves drawing horizontal lines at key Fibonacci ratios (23.6%, 38.2%, 50%, 61.8%, and 78.6%) between a significant price swing high and low. Swing traders rely on these levels to anticipate where a pullback might end and the primary trend could resume, making it one of the best technical indicators for swing trading entry and exit planning.
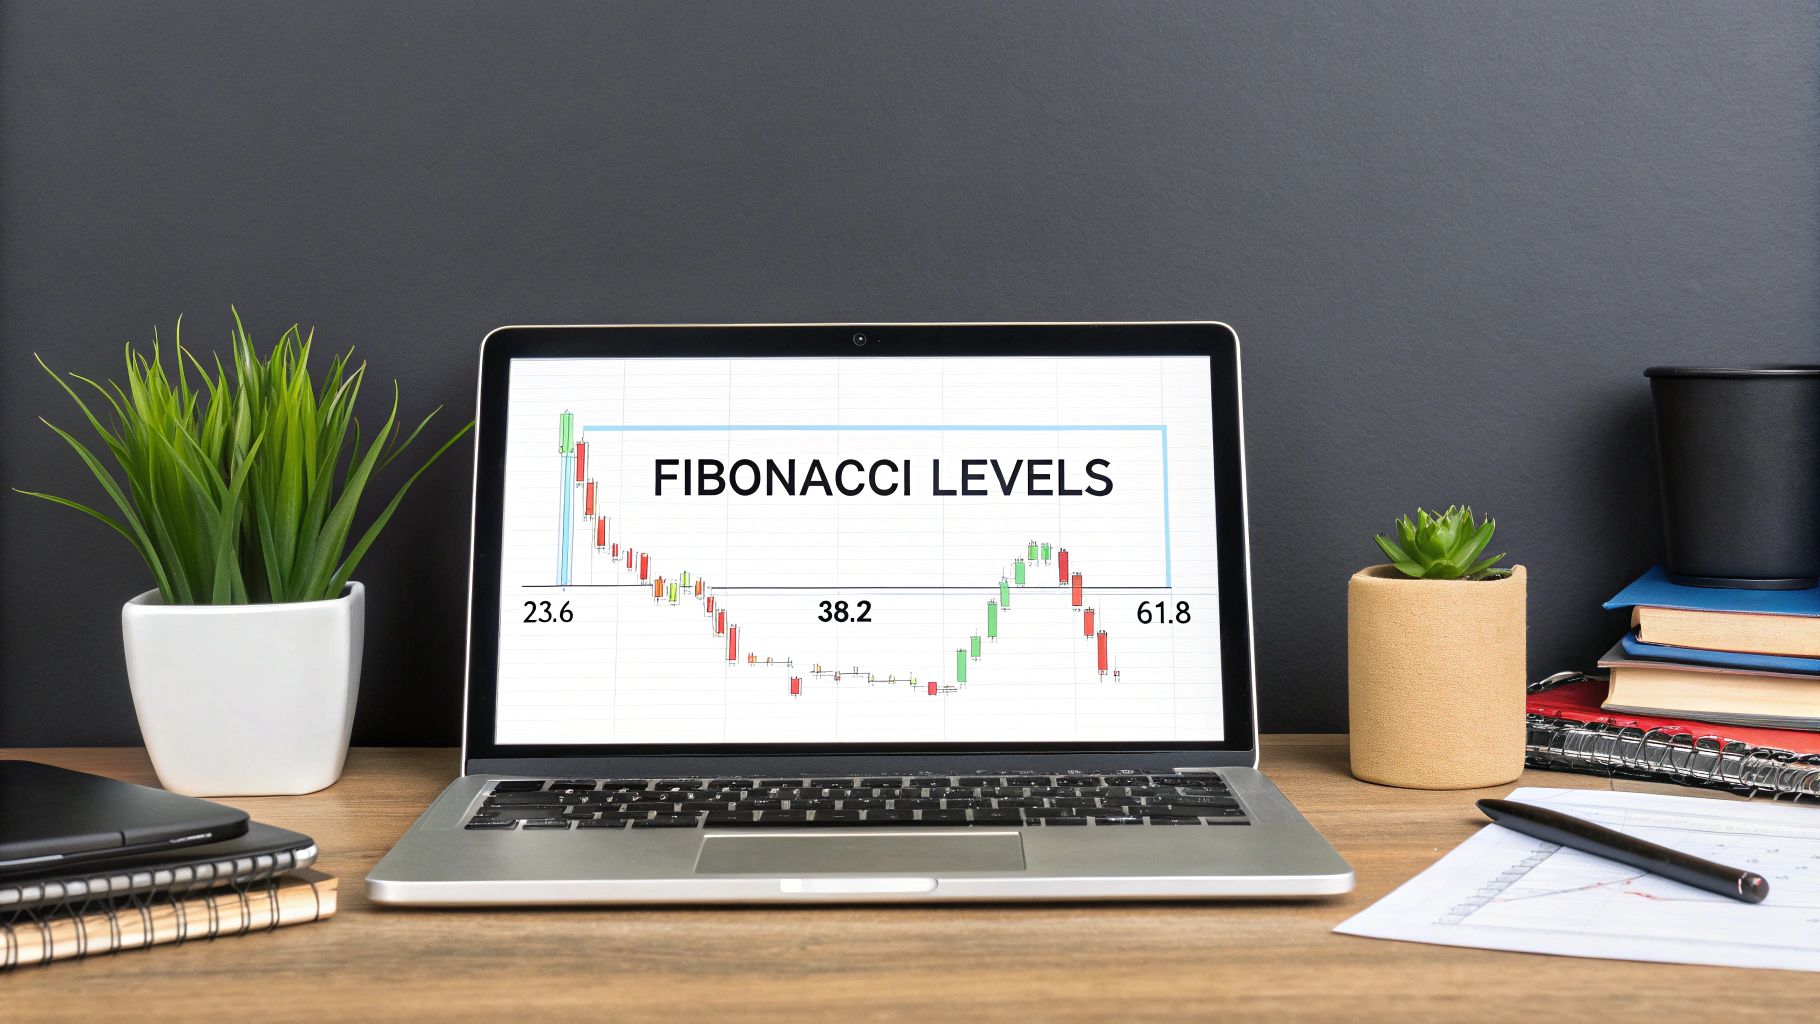
The core idea is that after a significant price move, the asset will often "retrace" or pull back a predictable portion of that move before continuing in the original direction. These Fibonacci levels act as hidden zones of interest where buying or selling pressure is likely to emerge. For example, if a cryptocurrency rallies from $50 to $60, a swing trader would watch for a pullback to the 61.8% level ($53.82) as a high-probability entry point to join the uptrend.
Practical Application for Swing Traders
Swing traders primarily use Fibonacci Retracement on 1-hour to daily charts to map out entries during corrective phases. In a strong uptrend, a shallow pullback to the 38.2% or 50% level often signals robust momentum and offers a chance to enter before the next leg up. In contrast, a deeper retracement to the 61.8% or 78.6% level might suggest a weaker trend but can provide entries with a more attractive risk-reward ratio.
Key Insight: The most powerful signals occur when a Fibonacci level converges with other technical elements. This is known as confluence. For example, if the 61.8% retracement level of an upward swing aligns perfectly with a previous resistance level (now potential support) and a 50-period moving average, it creates a high-probability "buy zone." A trader seeing this confluence would place their buy order with much higher confidence.
Actionable Fibonacci Strategies
- Drawing the Tool: Always draw from the start of a swing to its end. For an uptrend, draw from the swing low to the swing high. For a downtrend, draw from the swing high to the swing low.
- Confirmation is Key: Wait for confirmation before entering a trade. A bounce off a Fibonacci level confirmed by a bullish candlestick pattern (like a hammer or engulfing candle) significantly increases the probability of a successful trade.
- Integrating with CryptoMox: Use CryptoMox projections to validate potential bounces at key Fibonacci levels. If an asset is pulling back to its 50% retracement level on the 4-hour chart and CryptoMox issues a high-confidence "Upward Trend" projection for the next 12 hours, this confluence provides a powerful signal to enter a long position with greater assurance.
7. Volume Profile, Support and Resistance
Volume Profile, combined with classic support and resistance, is not a traditional oscillator but a powerful analytical method. Volume Profile displays trading activity at different price levels over a specified time, revealing where significant buying and selling occurred. When paired with support (price floors) and resistance (price ceilings), it provides a three-dimensional view of the market, which is why it's one of the best technical indicator combinations for swing trading.
Unlike lagging indicators, this combination maps out the market's structure, showing where value is perceived and where price is likely to react. The Point of Control (POC), the price level with the highest traded volume, often acts as a powerful magnet for price and a dynamic support/resistance level. This is crucial for swing traders who need to identify high-conviction entry and exit zones for trades lasting several days.
Practical Application for Swing Traders
Swing traders can apply Volume Profile to daily or 4-hour charts to identify high-volume nodes (HVNs) and low-volume nodes (LVNs). HVNs represent areas of price agreement and consolidation, often forming strong support or resistance. Conversely, LVNs signify areas where price moved quickly with little interest, making them prone to rapid price action once entered.
For example, a swing trader might notice a stock breaking above a key resistance level on the daily chart. By checking the Volume Profile, they see the breakout occurred on high volume and is moving into an LVN. This indicates a low-friction path upward, strengthening the case for a long entry targeting the next HVN as a take-profit level.
Key Insight: The most potent trades often occur when price breaks out of a high-volume "value area" and into a low-volume zone. This signifies a shift in market sentiment and a lack of obstacles, often leading to a swift and extended price move perfect for capturing a swing. For instance, if price has been consolidating between $40-$45 (an HVN) and then breaks above $45 into a region where very little volume was traded (an LVN), it could quickly rally to the next HVN at $50.
Actionable Volume Profile Strategies
- Parameter Settings: Use a session-based Volume Profile for intraday analysis or a visible range profile on the 4-hour and daily charts to analyze the current swing structure. A 20-period moving average on volume helps identify significant volume spikes (look for >150% of the average on breakouts).
- Confirmation with Price Action: A breakout above a resistance level is only confirmed if accompanied by a significant increase in volume. If price breaks a key level on weak volume, it's often a "fakeout" or trap.
- Integrating with CryptoMox: Validate support and resistance zones with CryptoMox projections. If price is approaching a major support level identified by Volume Profile and CryptoMox projects a high-confidence reversal, it provides dual confirmation for a long entry. This synergy combines historical market structure with forward-looking analysis to pinpoint high-probability swing points.
8. Ichimoku Cloud (Ichimoku Kinko Hyo)
The Ichimoku Cloud, or Ichimoku Kinko Hyo, is an all-in-one technical indicator that provides a complete picture of the market at a single glance. Developed by Goichi Hosoda, it defines support and resistance, identifies trend direction, gauges momentum, and provides trading signals, making it one of the best technical indicators for swing trading due to its comprehensive nature.
The "Cloud" (Kumo) is its most prominent feature, representing dynamic support and resistance zones. A price trading above the cloud suggests a bullish trend, while a price below it indicates a bearish trend. The other components, the Tenkan-sen (Conversion Line) and Kijun-sen (Base Line), act like moving averages to signal momentum shifts.
Practical Application for Swing Traders
Swing traders find the Ichimoku Cloud exceptionally useful on the 4-hour and daily charts, as it provides a clear, long-term market perspective. For instance, if a cryptocurrency breaks above the cloud on the daily chart and the faster Tenkan-sen crosses above the slower Kijun-sen, it generates a strong bullish signal. A trader could enter a long position, using the top of the cloud as a dynamic stop-loss level.
Key Insight: The Chikou Span (Lagging Span) is a powerful confirmation tool. It is the current price plotted 26 periods in the past. If the Chikou Span is above the price from 26 periods ago and is unobstructed by the price or the cloud, it confirms the strength of the bullish trend, giving swing traders higher confidence in their long positions. Think of it as a final "all clear" signal before committing to a trade.
Actionable Ichimoku Strategies
- Trend Confirmation: The primary rule for swing trading is simple: only take long trades when the price is above the cloud and short trades when the price is below the cloud. This filters out low-probability trades against the dominant trend.
- Momentum Entry: Use the Tenkan/Kijun cross as your primary entry trigger. A bullish cross (Tenkan over Kijun) above the cloud is a high-probability long entry. A bearish cross (Tenkan under Kijun) below the cloud signals a strong short entry.
- Integrating with CryptoMox: Validate Ichimoku signals with forward-looking data. If the price breaks out of the Kumo Cloud to the upside and CryptoMox shows a high-confidence bullish projection for the next 72 hours, it provides powerful confirmation. This dual validation helps you commit to the swing trade with greater certainty, filtering out false breakouts.
9. Rate of Change (ROC) and Momentum Indicators
The Rate of Change (ROC) is a pure momentum oscillator that measures the percentage change in price between the current price and the price a certain number of periods ago. It oscillates around a central zero line, providing a clear and objective measure of a trend's velocity. This makes it one of the best technical indicators for swing trading, as it helps identify accelerating momentum and potential exhaustion points.
When ROC is positive and rising, it signals strong upward momentum. Conversely, when it is negative and falling, it indicates accelerating downward momentum. Its simplicity is its strength, allowing swing traders to quickly gauge the underlying force driving a price move and anticipate potential reversals or continuations.
Practical Application for Swing Traders
Swing traders primarily use ROC to confirm trend strength and spot divergences. For instance, on a 4-hour chart, if a cryptocurrency is breaking out of a consolidation pattern, a trader can check if the ROC is decisively crossing above the zero line. This crossover confirms that momentum is building behind the move, increasing the probability of a successful swing trade.
Key Insight: The most powerful ROC signal is divergence, especially near historical extremes. A bearish divergence occurs when the price pushes to a new high, but the ROC indicator prints a lower high. For example, if a stock rallies to $200 and the ROC hits +15%, and then it rallies further to $205 but the ROC only reaches +10%, this signals that the upward momentum is fading and a reversal or deep pullback is likely. This provides a high-probability short entry signal.
Actionable ROC Strategies
- Parameter Settings: The standard setting is often 12 or 14 periods. For shorter-term swings on a 1-hour chart, a more sensitive setting like 9 or 10 can provide earlier signals. For longer swings on a 4-hour or daily chart, a 20 or 21-period ROC will smooth out the readings and reduce false signals.
- Confirmation with Price Action: Use ROC zero-line crossovers as a confirmation tool, not a standalone signal. If the price breaks above a key resistance level and the ROC simultaneously crosses above zero, it provides strong validation for a long entry.
- Integrating with CryptoMox: Combine ROC signals with forward-looking data for a powerful edge. If you spot a bullish divergence on the 4-hour ROC (price lower low, ROC higher low) and CryptoMox projects a high-confidence uptrend for the next 24 hours, it significantly validates the signal and strengthens your conviction to enter a long position.
10. Moving Averages (Simple, Exponential, Weighted)
Moving Averages (MAs) are fundamental trend-following indicators that smooth price action to provide a clearer view of the underlying trend direction. By averaging an asset's price over a specific number of periods, they filter out market noise, making them one of the best technical indicators for swing trading. The most common types are the Simple Moving Average (SMA), which gives equal weight to all prices, and the Exponential Moving Average (EMA), which emphasizes more recent price data.
Swing traders use MAs to identify trend direction, find dynamic support and resistance levels, and generate entry and exit signals. For example, a consistent uptrend is often characterized by the price staying above a key moving average, such as the 20-period EMA or 50-period SMA. Bounces off these MAs can offer high-probability entry points in the direction of the trend.
Practical Application for Swing Traders
On the 1-hour or 4-hour charts favored by swing traders, MAs act as a dynamic guide for trade management. A trader might enter a long position when the price of a cryptocurrency pulls back to and respects the 50-period EMA in a confirmed uptrend. Their stop-loss could be placed just below this EMA, providing a clear and logical point of invalidation for the trade setup.
Key Insight: The "golden cross" and "death cross" are powerful long-term signals. A golden cross occurs when a shorter-term MA (like the 50-period) crosses above a longer-term MA (like the 200-period), signaling a potential major bull market. For example, if the 50-day SMA for a stock crosses above its 200-day SMA, a swing trader would then have high confidence to buy on any small dips or pullbacks on the 4-hour chart.
Actionable MA Strategies
- Parameter Settings: Use a 20-period EMA for short-term trend direction and a 50-period SMA for medium-term trend confirmation. A faster EMA responds quickly to momentum shifts, while a slower SMA provides a more stable trend baseline.
- Confirmation with Crossovers: A popular swing trading strategy is to wait for the 20 EMA to cross above the 50 SMA to confirm an uptrend before looking for long entries. Conversely, a cross below signals a potential downtrend.
- Integrating with CryptoMox: Validate MA-based signals with forward-looking data. If the price on a 4-hour chart bounces off the 50 SMA and CryptoMox projects a high-confidence uptrend for the next 48 hours, it dramatically increases the probability of a successful long trade. This helps you avoid false signals where the price breaks the MA shortly after your entry.
Top 10 Swing Trading Indicators Comparison
| Indicator | 🔄 Implementation Complexity | ⚡ Resource Requirements | ⭐📊 Expected Outcomes | 💡 Ideal Use Cases | ⭐ Key Advantages |
|---|---|---|---|---|---|
| Relative Strength Index (RSI) | Low — single oscillator, easy to compute | Low — price series only | Momentum readings; clear overbought/oversold and divergence signals (can lag in trends) | Ranging markets, swing reversal entries, divergence spotting | Simple thresholds (70/30); easy to interpret; early reversal warnings |
| Moving Average Convergence Divergence (MACD) | Medium — multiple EMAs + histogram | Low — price series, minor compute | Trend/momentum shifts; crossovers and histogram signal strength (lagging in fast moves) | Trend-following swings, multi-timeframe confirmations | Clear crossover signals; histogram shows momentum changes across timeframes |
| Bollinger Bands | Medium — SMA + standard deviation calc | Low — price series | Volatility envelope; squeeze → breakout, band walks → strong trends | Volatility breakouts, mean reversion, dynamic support/resistance | Dynamic SR levels; visual volatility measure; squeeze detection |
| Stochastic Oscillator | Low — %K/%D cross system | Low — price range data | Fast overbought/oversold crossovers and divergences (prone to whipsaws) | Ranging/sideways markets, short-term swing entries | Very responsive; multiple crossover opportunities; good in ranges |
| Average True Range (ATR) | Low — average true range formula | Low — price highs/lows/close | Objective volatility metric for stops and sizing; no direction signal | Volatility-based stop placement, position sizing, breakout strength confirmation | Asset-agnostic volatility measure; objective stop/position rules |
| Fibonacci Retracement Levels | Medium — manual swing selection (subjective) | Low — drawing tool, price points | Potential support/resistance and pullback targets (subjective reliability) | Pullback entries, profit targets, confluence with S/R or indicators | Widely watched levels; clear visual targets; multi-timeframe applicability |
| Volume Profile, Support & Resistance | Medium–High — volume-at-price and level analysis | Medium–High — quality volume data, advanced platform | Identifies high-volume nodes/POC, confirms breakouts; reveals institutional interest | Breakout validation, key level trading, volume-based entries/exits | Objective level identification via volume; confirms move validity |
| Ichimoku Cloud | High — multiple lines, forward/back plots | Medium — price series, more parameters | All-in-one trend, SR, momentum and future-projection (steep learning curve) | Trend identification, comprehensive setups, multi-timeframe analysis | Comprehensive visual system; reduces need for multiple separate indicators |
| Rate of Change (ROC) & Momentum | Low — simple percent-change calc | Low — price series | Percent momentum and zero-line cross signals; divergence detection | Momentum confirmation, divergence spotting, trend strength checks | Simple, objective momentum measure; easily customizable periods |
| Moving Averages (SMA/EMA/WMA) | Low — basic averaging (varies by type) | Low — price series | Trend smoothing and cross signals; lagging but reliable trend bias | Trend confirmation, pullback entries, MA crossover strategies | Universally understood; flexible (periods/types); widely used (self-fulfilling) |
From Indicators to Action: Building Your Swing Trading System
We've explored a powerful arsenal of the best technical indicators for swing trading, from momentum oscillators like the RSI and Stochastic to trend-following tools like Moving Averages and the Ichimoku Cloud. Each indicator offers a unique lens through which to view market dynamics, providing critical data on momentum, trend, volatility, and key price levels. However, mastering individual indicators is only the first part of the equation. True trading proficiency emerges not from finding a single "perfect" indicator, but from intelligently combining them into a cohesive, personalized trading system.
The core principle behind building a robust system is confluence. A signal from a single indicator is merely a suggestion; a signal confirmed by two or three non-correlated indicators is a high-probability hypothesis. This is where the art and science of technical analysis merge, transforming you from an indicator-follower into a strategic market participant.
The Power of Confluence: A Practical Example
Imagine you're analyzing a potential swing trade on the 4-hour chart. You notice the price is approaching a key support level you've identified using historical price action and a Volume Profile POC. This is your initial point of interest.
Instead of acting immediately, you look for confirmation.
- RSI Confirmation: As the price nears the support, the Relative Strength Index (RSI) dips below 30, signaling an oversold condition.
- Candlestick Confirmation: At the support level, a bullish engulfing candle or a hammer candlestick pattern forms, indicating that buyers are stepping in and rejecting lower prices.
- Fibonacci Confirmation: You draw Fibonacci retracement levels from the previous swing low to the swing high, and discover that your support level aligns perfectly with the 61.8% "golden ratio" retracement level.
Now, you no longer have just a support level. You have a confluence of four distinct signals all pointing to the same conclusion: a high-probability long entry. This multi-layered approach filters out market noise and dramatically increases the quality of your trade setups.
From Lagging Signals to Forward-Looking Conviction
While the classic tools we've discussed are foundational, they share a common limitation: they are inherently reactive. They analyze past price data to generate signals about what might happen next. To gain a true edge in today's fast-moving markets, traders must complement this reactive analysis with proactive, forward-looking insights.
This is where integrating a tool like CryptoMox can fundamentally change your approach. Imagine you've identified the high-confluence setup described above. Before placing your trade, you consult CryptoMox's AI-driven projections for that asset on the 4-hour timeframe.
Key Insight: You can use your traditional indicator-based system to find potential trade setups, and then use CryptoMox's forward-looking projections and Confidence Scores as the final, decisive filter. This bridges the gap between reacting to the past and anticipating the future.
If CryptoMox projects a likely upward move from your identified support level and assigns it a high Confidence Score, your trade thesis is now validated by both historical price patterns and a forward-looking analytical engine. This provides an unparalleled level of conviction, helping you execute with confidence and manage the trade more effectively.
Your Actionable Next Steps
Building a system that works for you is an iterative process of testing, learning, and refining. Don't try to master all ten indicators at once. Instead, follow these steps to build your foundation:
- Select Your Core Tools: Choose 2-3 indicators from this list that resonate with your trading style. A great starting combination is a trend indicator (like Exponential Moving Averages), a momentum oscillator (like RSI), and a volatility tool (like Bollinger Bands or ATR).
- Define Your Rules: Write down specific, non-negotiable rules for your system. What constitutes an entry signal? Where will your stop-loss be placed? What are your profit-taking criteria?
- Backtest and Refine: Go back in time on the charts and manually backtest your system. See how it would have performed. Document every trade and identify weaknesses in your rules, then refine them.
- Forward-Test with a Demo Account: Once you're confident in your backtested results, trade your system on a demo account with zero financial risk. This tests your ability to execute your plan in a live market environment.
By methodically building and testing your unique trading system, you move beyond simply using indicators and begin to wield them as tools in a well-honed, strategic process. This discipline is what separates consistently profitable traders from the crowd, empowering you to navigate the markets with clarity, precision, and confidence.
Ready to stop guessing and start anticipating? Elevate your indicator-based strategy with AI-powered projections. Sign up for CryptoMox today to integrate forward-looking analysis and data-driven Confidence Scores into your trading system. CryptoMox